\ 迷ったらまずTechAcademyの無料カウンセリング! /
【Matplotlib】複数グラフの配置と大きさ (Gridspec)

グラフを表示するときに複数のグラフをまとめて表示したほうがわかりやすいことがあります
本記事では,Matplotlibで複数のグラフを1つのウィンドウ内に表示させる方法を解説します
行列方式とGridSpecで思い通りに配置する2つの方式について紹介します
目次
行列方式で複数のグラフを配置する
行列方式で1つのウィンドウ内に複数のグラフを配置することができます
plt.subplots(行, 列)のようにカッコ内に行,列の順序で個数を指定してください
pyplot.subplots
- 引数
-
- nrows, ncols (int) : グリッドの行数/列数。
- sharex, sharey (‘none’, ‘all’, ‘row’, ‘col’) : x 軸(sharex)または y 軸(sharey)間のプロパティの共有
- squeeze (True or False) : 返値の Axes の配列の次元を制御
- 返値
- 公式ドキュメント
1行2列のグラフレイアウト
pyplot.subplots関数をつかって,1行2列のグラフを作成します
fig, axs = plt.subplots(1, 2)
axs[0].plot(x, y1) : 0番目のAxes。axs[1].plot(x, y1, color='red') : 1番目のAxes。
# step0 ライブラリの読み込み
import matplotlib.pyplot as plt
import numpy as np

# step1 データの作成
x = np.linspace(0, 10, 100)
y1 = 4 + 2 * np.sin(2 * x)
y2 = 4 + 2 * np.cos(2 * x)

# step2 グラフフレームの作成
fig, axs = plt.subplots(1, 2, figsize=(8, 4), layout='constrained')

# step3 グラフの描画
axs[0].plot(x, y1)
axs[0].plot(x, y2)
axs[1].plot(x, y1, color='red')
axs[1].plot(x, y2, color='gray')

# step4 軸ラベルとタイトルの設定
axs[0].set_xlabel('X1 label')
axs[0].set_ylabel('Y1 label')
axs[0].set_title('Title 1')
axs[1].set_xlabel('X2 label')
axs[1].set_ylabel('Y2 label')
axs[1].set_title('Title 2')

# step5 Figureの呼び出し
plt.show()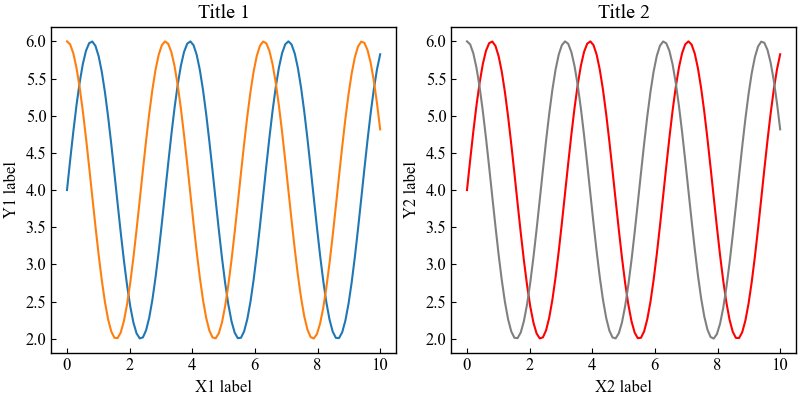
2行1列のグラフレイアウト
pyplot.subplots関数をつかって,2行1列のグラフを作成します
fig, axs = plt.subplots(2, 1)
axs[0].plot(x, y1) : 0番目のAxes。axs[1].plot(x, y1, color='red') : 1番目のAxes。
# step2 グラフフレームの作成
fig, axs = plt.subplots(2, 1, figsize=(6, 6), layout='constrained')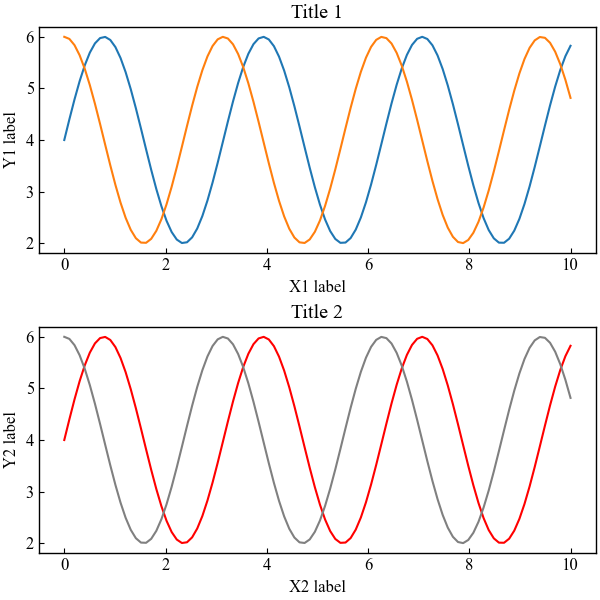
2行2列のグラフレイアウト
pyplot.subplots関数をつかって,2行2列のグラフを作成します
fig, axs = plt.subplots(2, 2)
axs[0, 0].plot(x, y1) : 0行0列のAxes。axs[0, 1].plot(x, y2, color='green') : 0行1列のAxes。
# step2 グラフフレームの作成
fig, axs = plt.subplots(2, 2, figsize=(8, 6), layout='constrained')

# step3 グラフの描画
axs[0, 0].plot(x, y1)
axs[0, 1].plot(x, y2, color='green')
axs[1, 0].plot(x, y1, color='red')
axs[1, 1].plot(x, y2, color='gray')

# step4 軸ラベルとタイトルの設定
axs[0, 0].set_xlabel('X1 label')
axs[0, 0].set_ylabel('Y1 label')
axs[0, 0].set_title('Title 1')
axs[0, 1].set_xlabel('X2 label')
axs[0, 1].set_ylabel('Y2 label')
axs[0, 1].set_title('Title 2')
axs[1, 0].set_xlabel('X3 label')
axs[1, 0].set_ylabel('Y3 label')
axs[1, 0].set_title('Title 3')
axs[1, 1].set_xlabel('X4 label')
axs[1, 1].set_ylabel('Y4 label')
axs[1, 1].set_title('Title 4')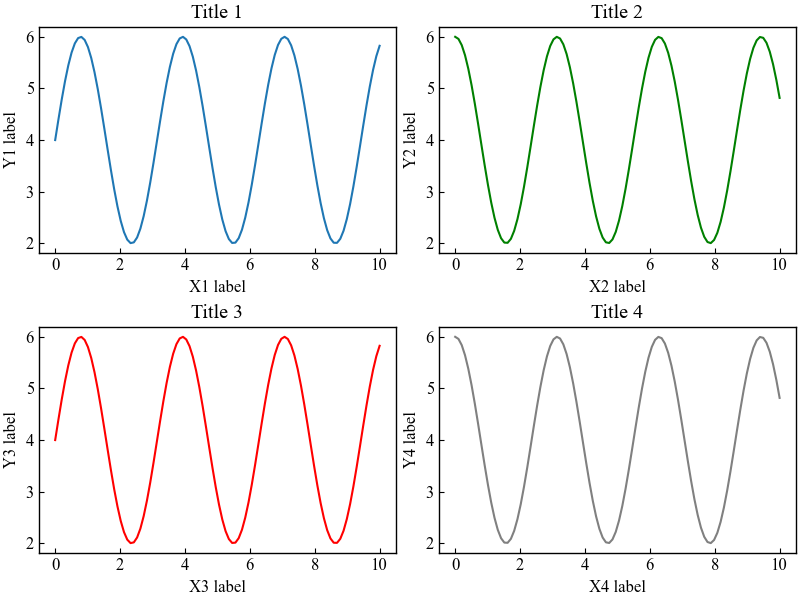
for文でコードを減らす (ndarray.flat)
2行2列のグラフレイアウトのようにグラフが多くなるに従い,コードも増えていきます
numpy.ndarray.flat関数をつかって,Axesの配列を1次元配列にしてfor文にしますaxs.flat
for i, ax in enumerate(axs.flat):
    # step3 グラフの描画
    ax.plot(x, y1, color='C'+str(2*i))
    ax.plot(x, y2, color='C'+str(2*i+1))

    # step4 軸ラベルとタイトルの設定
    ax.set_xlabel('X'+str(i+1)+' label')
    ax.set_ylabel('Y'+str(i+1)+' label')
    ax.set_title('Title '+str(i+1))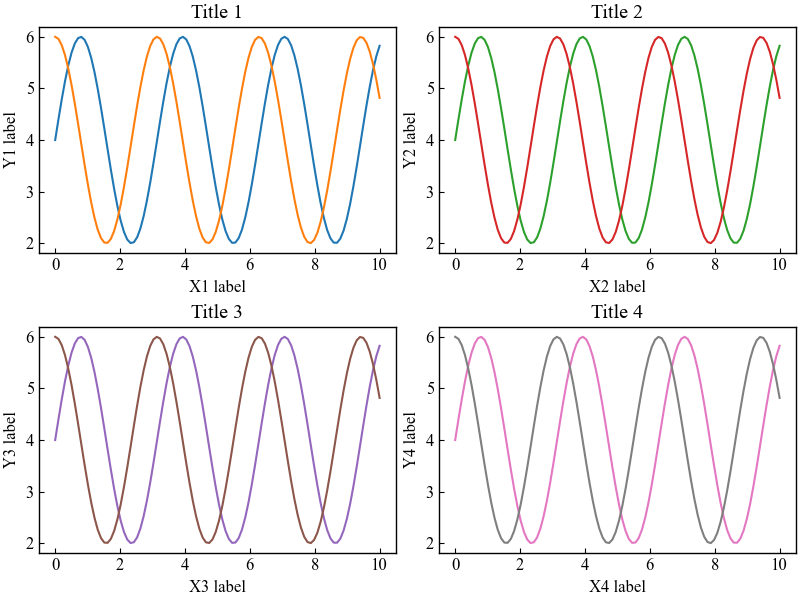
行列を転置させると列ごとの順序になりますaxs.T.flat
for i, ax in enumerate(axs.T.flat):
    # step3 グラフの描画
    ax.plot(x, y1, color='C'+str(2*i))
    ax.plot(x, y2, color='C'+str(2*i+1))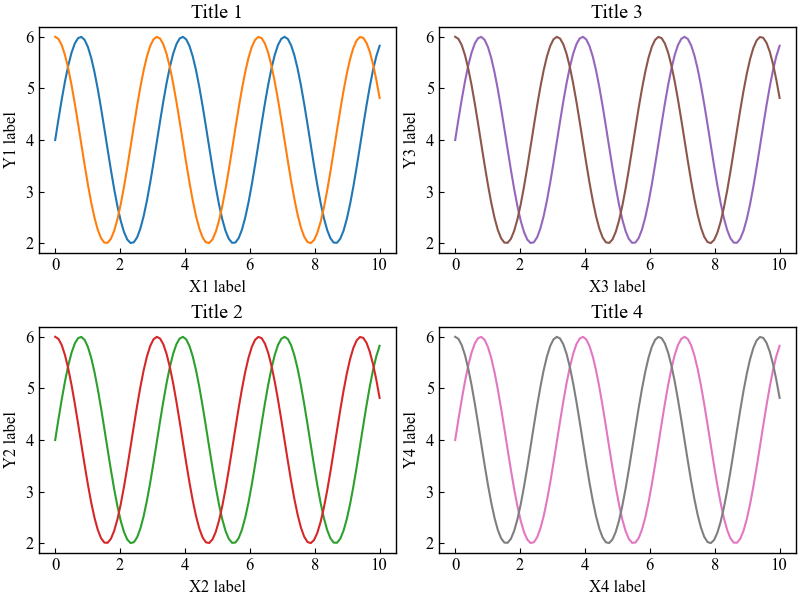
各グラフに凡例を追加する
凡例はグラフの描画時にラベルの追加してAxes.legend関数を使います
ax.legend(): 各グラフに凡例を追加
for i, ax in enumerate(axs.flat):
    # step3 グラフの描画
    ax.plot(x, y1, color='C'+str(2*i), label='ax'+str(2*i+1))
    ax.plot(x, y2, color='C'+str(2*i+1), label='ax'+str(2*i+2))
    # 凡例の追加
    ax.legend()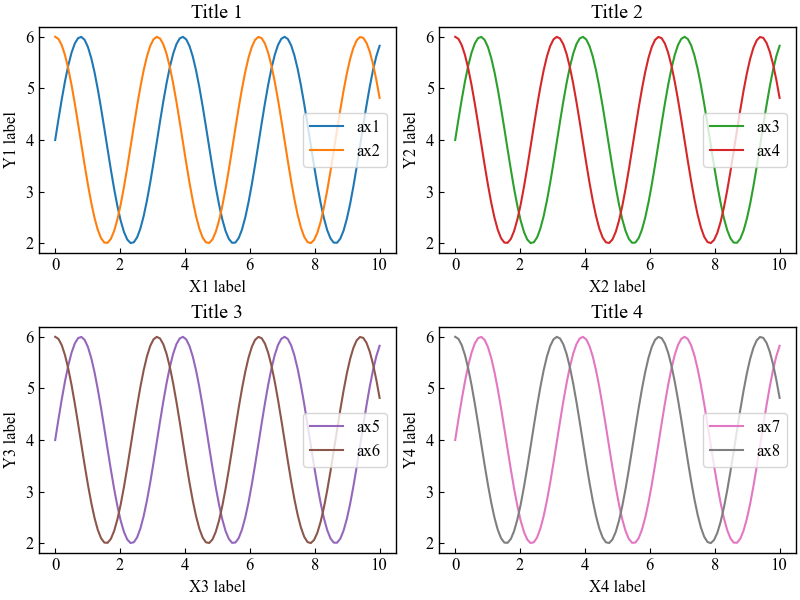
グラフ全体で凡例を1つ追加する
Figureに凡例をつけるとまとめて表示できます
fig.legend(): グラフ全体で1つ凡例を追加
for i, ax in enumerate(axs.flat):
    # step3 グラフの描画
    ax.plot(x, y1, color='C'+str(2*i), label='ax'+str(2*i+1))
    ax.plot(x, y2, color='C'+str(2*i+1), label='ax'+str(2*i+2))
# 凡例の追加
fig.legend()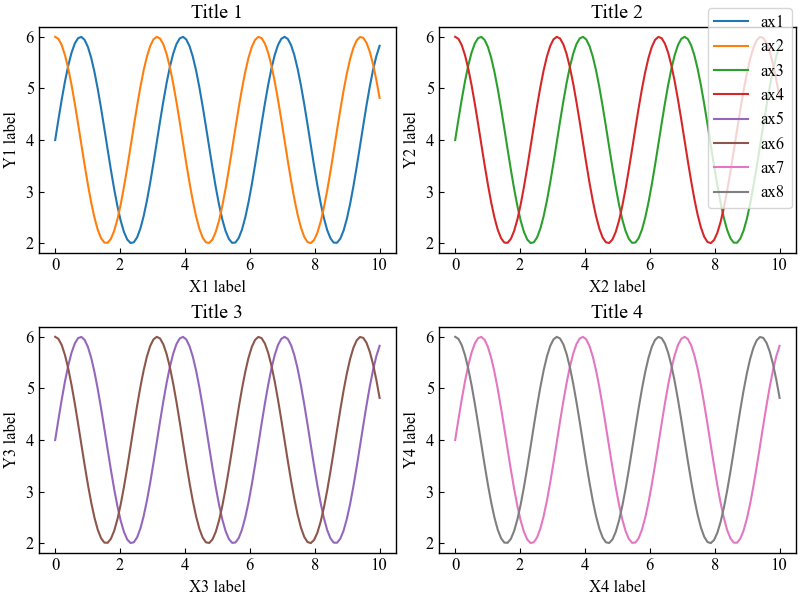
GridSpecで自由にグラフを配置する
GridSpecを使うとグリッドレイアウトとなり思い通りのグラフ配置を実現できます
gridspec.GridSpec
- 引数
-
- nrows, ncols (int) : グリッドの行数/列数。
- figure (Figure) : 適切なレイアウトグリッドを作成するためのconstrained layoutにのみ使用される。
- left, right, top, bottom (float) : 図の幅または高さに対するサブプロットの割合。
- wspace, hspace (float) : サブプロット間のスペース。平均軸幅の何分の一かで表される。
- 公式ドキュメント
コードの最初にimportしてください
import matplotlib.gridspec as gridspecGridSpecで3×3のfigに自由に配置する
3×3のfigのグリッドレイアウトに5個のグラフを配置します
gridspec.GridSpecの引数にグリッドの行列 (3×3) とFigure (fig) を入力しますgs = gridspec.GridSpec(3, 3, figure=fig)
add_subplotの引数に配置したいグリッドを指定しますax1 = fig.add_subplot(gs[0, :]): 1行目,列はすべてax2 = fig.add_subplot(gs[1, :-1]): 2行目,最後の列までax3 = fig.add_subplot(gs[1:, -1]): 2行目以降, 最後の列
# step0 ライブラリの読み込み
import matplotlib.pyplot as plt
import numpy as np
import matplotlib.gridspec as gridspec

# step1 データの作成
x = np.linspace(0, 10, 100)
y1 = 4 + 2 * np.sin(2 * x)
y2 = 4 + 2 * np.cos(2 * x)

# step2 グラフフレームの作成
fig = plt.figure(constrained_layout=True)
# 3行3列のグリッドレイアウト
gs = gridspec.GridSpec(3, 3, figure=fig)

# step3 グラフの描画
ax1 = fig.add_subplot(gs[0, :])
ax1.plot(x, y1, color='C0')

ax2 = fig.add_subplot(gs[1, :-1])
ax2.plot(x, y1, color='C1')

ax3 = fig.add_subplot(gs[1:, -1])
ax3.plot(x, y1, color='C2')

ax4 = fig.add_subplot(gs[2, 0])
ax4.plot(x, y1, color='C3')

ax5 = fig.add_subplot(gs[2, 1])
ax5.plot(x, y1, color='C4')

# step4 タイトルの設定
fig.suptitle('GridSpec 3×3')

# step5 Figureの呼び出し
plt.show()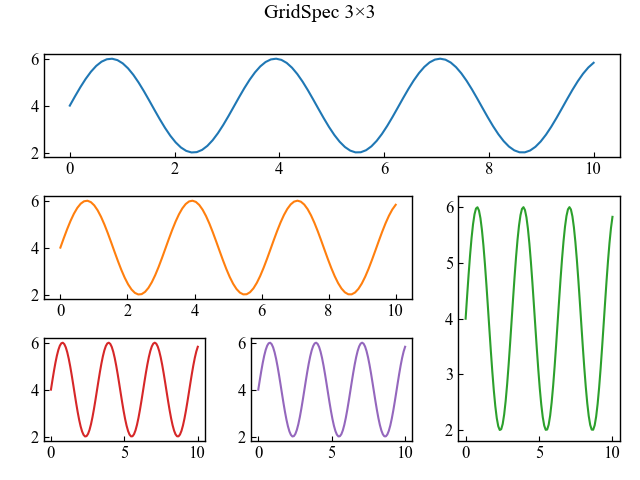
GridSpecFromSubplotSpecで列ごとにグラフを配置する
GridSpecFromSubplotSpecは,GridSpecで作成したグリッドレイアウトを継承することができます
GridSpecの列成分だけ継承すると,列ごとにグラフ配置ができます
GridSpecで1行2列のグリッドレイアウトを作成gs0 = gridspec.GridSpec(1, 2, figure=fig)
1列目をGridSpecFromSubplotSpecに継承し,3行1列のグリッドレイアウトを作成gs1 = gridspec.GridSpecFromSubplotSpec(3, 1, subplot_spec=gs0[0])
2列目をGridSpecFromSubplotSpecに継承し,2行1列のグリッドレイアウトを作成gs2 = gridspec.GridSpecFromSubplotSpec(2, 1, subplot_spec=gs0[1])
# step2 グラフフレームの作成
fig = plt.figure(constrained_layout=True)
# 1行2列のグリッドレイアウト
gs0 = gridspec.GridSpec(1, 2, figure=fig)

# step3 グラフの描画
# 1列目をGridSpecFromSubplotSpecに継承し,3行1列のグリッドレイアウトを作成
gs1 = gridspec.GridSpecFromSubplotSpec(3, 1, subplot_spec=gs0[0])
for n in range(3):
    ax = fig.add_subplot(gs1[n])
    ax.plot(x, y1, color='C'+str(n), label='ax'+str(n+1))

# 2列目をGridSpecFromSubplotSpecに継承し,2行1列のグリッドレイアウトを作成
gs2 = gridspec.GridSpecFromSubplotSpec(2, 1, subplot_spec=gs0[1])
for n in range(2):
    ax = fig.add_subplot(gs2[n])
    ax.scatter(x, y1, color='C'+str(n+3), label='ax'+str(n+4))
参考文献
制約付きレイアウトでの軸のサイズ変更
GridSpec
GridSpecの使い方
GridSpecFromSubplotSpec