\ 迷ったらまずTechAcademyの無料カウンセリング! /
【Matplotlib】凡例の設定まとめ!位置,色,ラベル (legend)

Matplotlibでグラフに凡例を追加する際、どの位置に配置できるのか,凡例の色やラベルの設定方法が分からず困惑してはいないでしょうか。
この記事ではMatplotlibの凡例に関する設定をほぼ網羅し、位置の指定や色の変更、ラベルの追加方法などを詳しく解説します。
読み終えた後、Matplotlibを使用してグラフに凡例を自在に配置し、色やラベルをカスタマイズする技術を習得します。グラフの見やすさや情報伝達力を向上させることができます。
目次
凡例のオプション一覧
グラフの凡例は,Axes.legend関数かpyplot.legend関数で表示します
本記事ではAxes.legend関数を使ったスタイルで解説します
Axes.legend, pyplot.legend
- 引数
-
- handles (配列) : 表示するグラフ(Axesオブジェクト)を指定
- labels (配列) : 凡例に表示されるラベル
- loc (文字列) : 凡例の場所.best, center, upper, lower, left, rightとそれらの組み合わせから選択できます
- bbox_to_anchor (BboxBase) : 凡例の配置.(x, y)もしくは(x, y, width, height)で座標を指定します
- prop (辞書) : FontProperties。辞書形式でフォントの種類,スタイル,サイズ,太さなど
- fontsize (int or 文字列) : フォントサイズ。propでサイズが指定されていれば無効
- labelcolor (color) : ラベルの色
- edgecolor (color) : 枠の色
- facecolor (color) : 背景の色
- frameon (True or False) : 凡例の枠の表示
- framealpha (float) : 凡例の透明度
- fancybox (True or False) : 凡例の枠の丸い縁
- shadow (True or False) : 凡例の影
- 返値
- 公式ドキュメント
デフォルトの凡例 (Axes.legend)
凡例を設定する際に,何も指定せずにデフォルトの凡例を表示します
グラフに凡例をつける
Axes.legend関数はグラフ(Axesオブジェクト)に凡例をつけて,カスタムすることができますax.legend()
下記のタブにコードとフローチャートでAxes.legendの使用方法を解説しています
# step0 ライブラリの読み込み
import matplotlib.pyplot as plt
import numpy as np

# step1 データの作成
x = np.linspace(0, 10, 100)
y1 = 4 + 2 * np.sin(2 * x)
y2 = 4 + 2 * np.cos(2 * x)

# step2 グラフフレームの作成
fig, ax = plt.subplots(figsize=(6, 4))

# step3 グラフの描画
ax.plot(x, y1, label='Sample 1')
ax.plot(x, y2, label='Sample 2')

# step4 凡例の設定
ax.legend()

# step5 タイトルと軸ラベルの設定
ax.set_title('Default Legend')
ax.set_xlabel('X Label')
ax.set_ylabel('Y Label')

# step6 Figureの呼び出し
plt.show()
複数のグラフの凡例を1つにする
複数のグラフを描画(=Figure内に複数のAxesオブジェクトを配置)するときに,Figureに凡例をつけると1つにまとめることができますplt.legend()
下記のタブにコードとフローチャートでAxes.legendの使用方法を解説をしています
# step1 データの作成
x = np.linspace(0, 10, 100)
y1 = 4 + 2 * np.sin(2 * x)
y2 = 4 + 2 * np.cos(2 * x)

# step2 グラフフレームの作成
fig, axs = plt.subplots(2, 2, figsize=(8, 4))

# step3 グラフの描画
axs[0, 0].plot(x, y1, label='Axes 1', color='C0')
axs[0, 1].plot(x, y2, label='Axes 2', color='C1')
axs[1, 0].plot(x, y2, label='Axes 3', color='C2')
axs[1, 1].plot(x, y2, label='Axes 4', color='C3')

# step4 凡例の設定
fig.legend()

# step5 タイトルと軸ラベルの設定
fig.suptitle('Default Legend with pyplot.legend')
fig.supxlabel('X Label')
fig.supylabel('Y Label')

# step6 Figureの呼び出し
plt.show()
凡例のラベルとグラフを指定 (labels, handles)
凡例に表示する際に,①どの名前で表示するか,②どのグラフを表示するかを決めます
labels: ラベルを指定handles: グラフ(Axesオブジェクト)を指定
ラベルの設定 (labels)
labelsでは,ラベルを配列で指定し,凡例に表示されるテキストを指定できますax.legend(labels=['Sample 4', 'Sample 5'])
Sample1→Sample4, Sample2→Sample5と再設定されています
# step3 グラフの描画
ax.plot(x, y1, label='Sample 1')
ax.plot(x, y2, label='Sample 2')

# step4 凡例の設定
# ラベルの再設定
ax.legend(labels=['Sample 4', 'Sample 5'])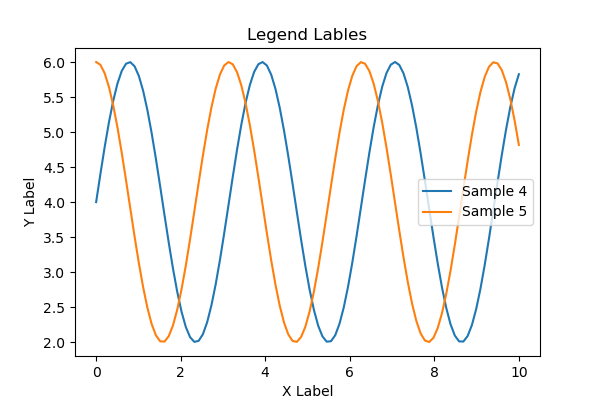
特定のグラフのみ表示
handlesでは,Axesオブジェクトを配列で指定し,特定のグラフのみを凡例に表示することができますax.legend(handles=[line1])
# step3 グラフの描画
line1, = ax.plot(x, y1, label='Axes 1')
line2, = ax.plot(x, y2, label='Axes 2')

# step4 凡例の設定
ax.legend(handles=[line1])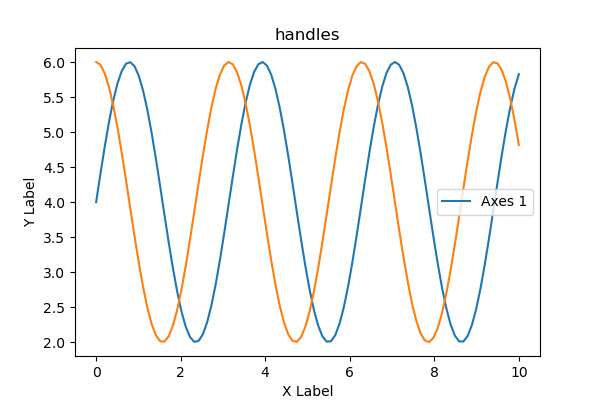
凡例の配置 (loc, bbox_to_anchor)
凡例の位置を決めるのはlocとbbox_to_anchorの2つがあり,組み合わせて使うことも可能です
loc: best, center, upper, lower, left, rightとそれらの組み合わせの文字列で指定bbox_to_anchor: (x, y)で座標指定
グラフ内に配置 (loc)
loc='best'で凡例をグラフ内の好きな場所に配置できます
best, center, upper, lower, left, rightとそれらの組み合わせから選択できます
# step4 凡例の設定
ax.legend(loc='center')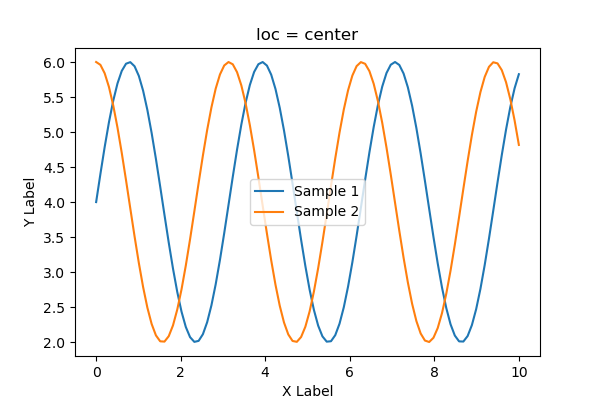
# step4 凡例の設定
ax.legend(loc='lower right')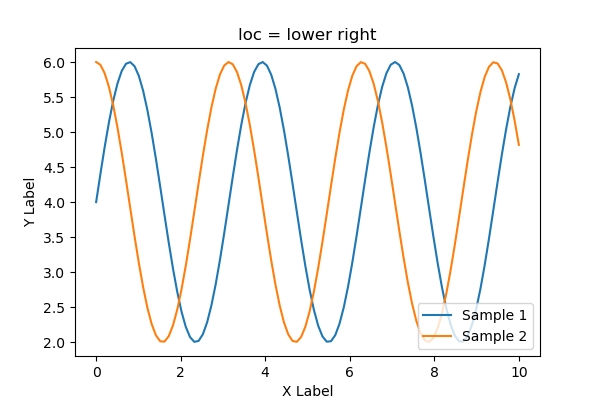
# step4 凡例の設定
ax.legend(loc='upper left')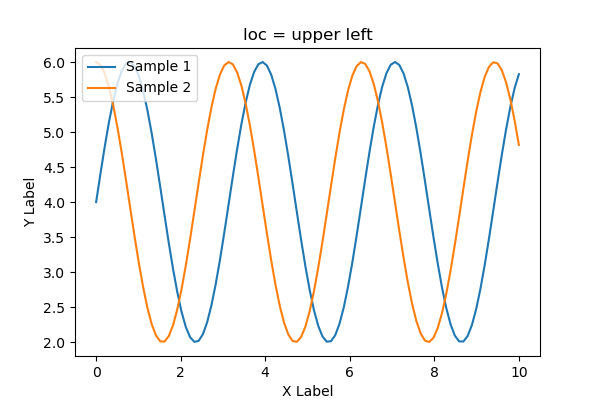
グラフ外に配置 (bbox_to_anchor)
bbox_to_anchor=(x, y)と座標を指定します
(0, 0), (0.5, 0.8), (1, 1.1)の3パターンで描画しました
凡例がグラフ内に収まらない時はplt.tight_layout()を使って調整します
# step4 凡例の設定
ax.legend(bbox_to_anchor=(0, 0))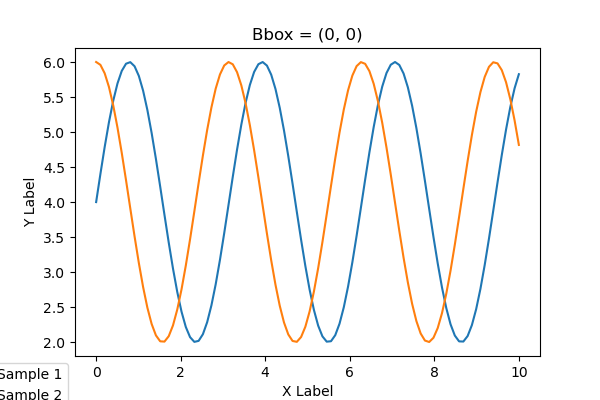
0.5がグラフの中心になります
# step4 凡例の設定
ax.legend(bbox_to_anchor=(0.5, 0.8))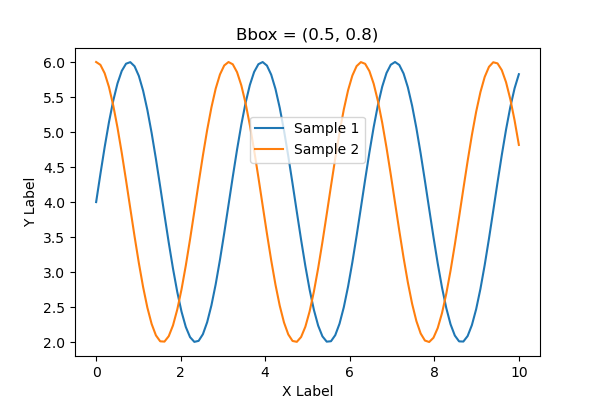
1以上も指定できます
# step4 凡例の設定
ax.legend(bbox_to_anchor=(1, 1.1))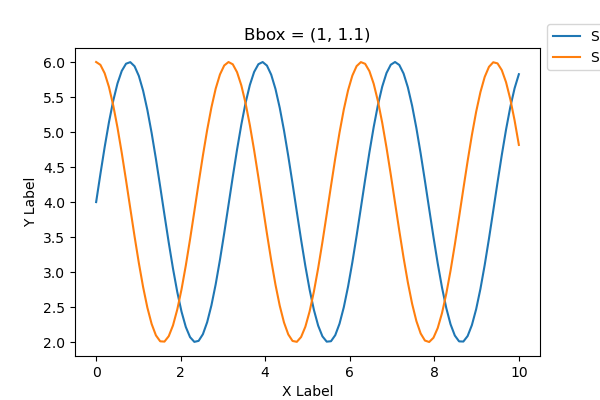
凡例がグラフ内に収まらない時はplt.tight_layout()を使って調整します
# step6 Figureの呼び出し
plt.tight_layout()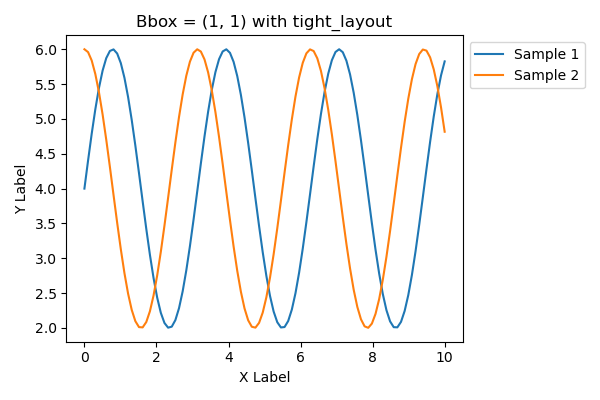
凡例のフォントと色 (prop, fontsize, labelcolor, edgecolor, facecolor)
凡例のフォントと色を設定します
prop: FontProperties。辞書形式でフォントの種類,スタイル,サイズ,太さなど。fontsize: フォントサイズ。propでサイズが指定されていれば無効。labelcolor: ラベルの色edgecolor: 枠の色facecolor: 背景の色
Pythonでの色の指定方法は下記を参考にしてください
あわせて読みたい

【Matplotlib】色設定まとめ! (RGB, 16進数, グレースケール, Tableau, CSS)
Matplotlibを使ってグラフや図を作成する際に、色の設定方法について迷っているかもしれません。 この記事ではMatplotlibの色に関する設定方法を詳しく解説します。 読…
フォントのカスタム (prop)
propは辞書形式でフォントの種類,スタイル,サイズ,太さなどをカスタムします
'weight' : 'bold'= フォントウェイト:太字'style' : 'italic'= フォントスタイル:イタリック'family' : 'Times New Roman'= フォント種類:Times New Roman
# step4 凡例の設定
ax.legend(prop={'weight': 'bold', 'style': 'italic', 'family': 'Times New Roman'})
フォントサイズ (fontsize)
fontsize はフォントサイズを変更します
ただし,propでサイズが指定されていれば無効になります
フォントサイズを文字列で指定するときは,'xx-small', 'x-small', 'small', 'medium', 'large', 'x-large', 'xx-largeを使います
# step4 凡例の設定
ax.legend(fontsize='large')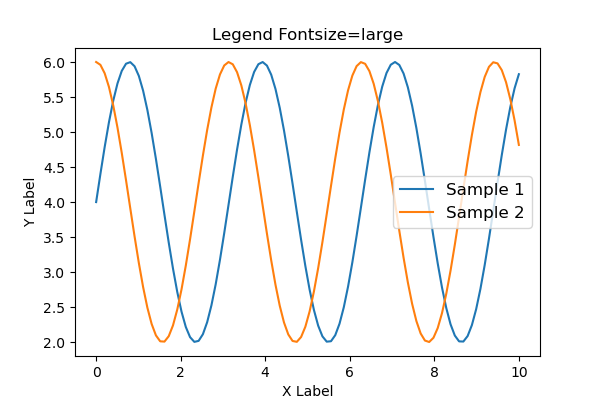
フォントサイズは数値で指定することもできます
# step4 凡例の設定
ax.legend(fontsize=20)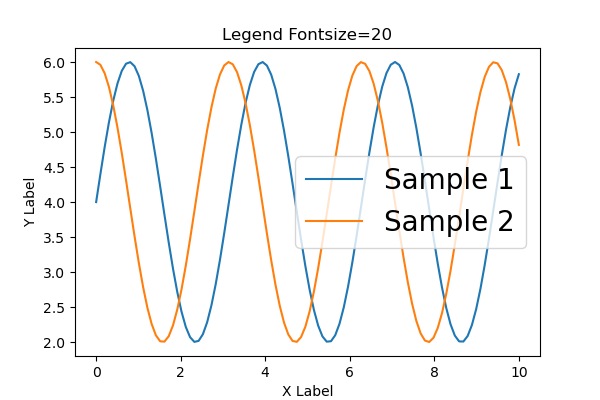
ラベルの色 (labelcolor)
labelcolorはラベルの色を変更します
'red'と色を直接指定します
# step4 凡例の設定
ax.legend(labelcolor='red')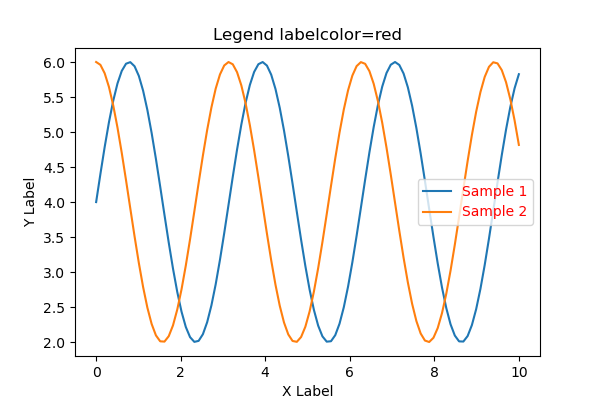
枠の色 (edgecolor)
edgecolorは凡例の枠の色を変更します
RGB文字列で色を指定します
# step4 凡例の設定
ax.legend(edgecolor='#00BCD4')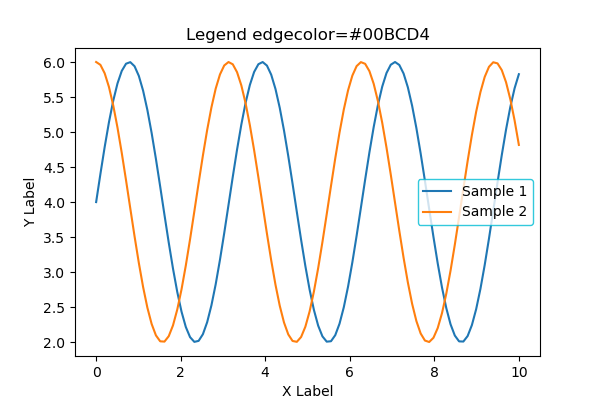
背景の色 (facecolor)
facecolorは凡例の背景の色を変更します
0~1の間の文字列を入力するとグレースケールとなります
'0': 黒'1': 白
# step4 凡例の設定
ax.legend(facecolor='0.8')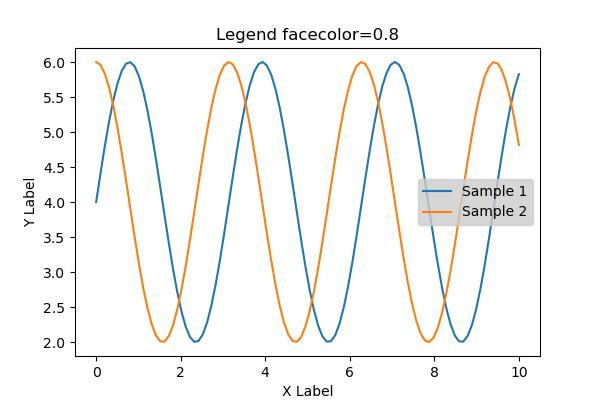
凡例のタイトル (title, title_properties, title_fontsize)
titleで凡例のタイトルを追加します
タイトルのフォントのカスタムは次節に詳細を解説します
# step4 凡例の設定
ax.legend(title='Legend Title')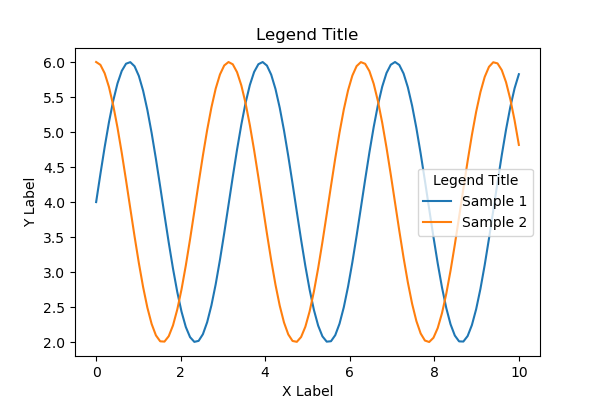
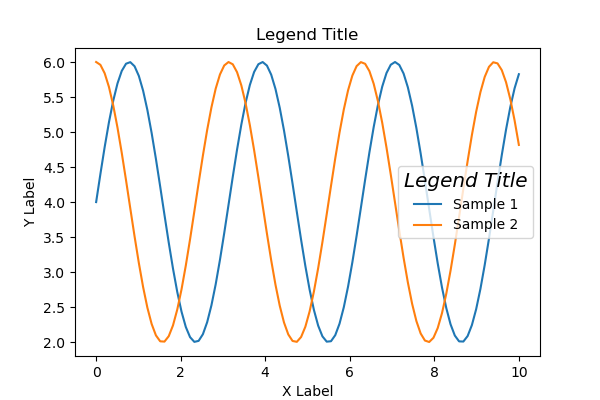
タイトルのフォントのカスタム (title_properties)
title_propertiesは辞書形式でフォントの種類,スタイル,サイズ,太さなどをカスタムします
'weight' : '500'= フォントウェイト'style' : 'oblique'= フォントスタイル:斜め'size' : 'x-large'= フォントサイズ
フォントサイズを文字列で指定するときは,'xx-small', 'x-small', 'small', 'medium', 'large', 'x-large', 'xx-largeを使います
# step4 凡例の設定
ax.legend(
    title='Legend Title',
    title_fontproperties={'weight': '500', 'style': 'oblique', 'size': 'x-large'}
)
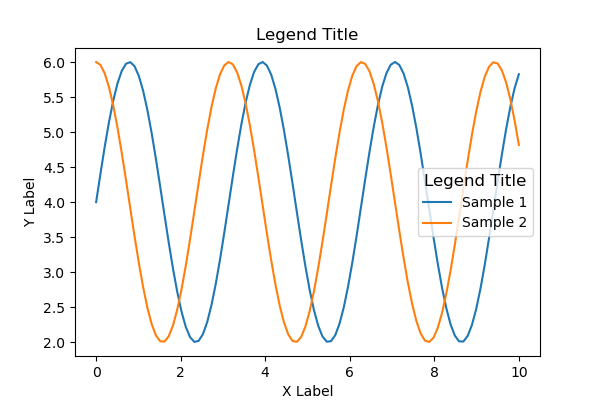
タイトルのフォントサイズ (title_fontsize)
title_fontsize はフォントサイズを変更します
ただし,title_propertiesでサイズが指定されていれば無効になります
フォントサイズを数値で指定しました
# step4 凡例の設定
ax.legend(
    title='Legend Title',
    title_fontsize='12'
)
凡例の枠 (frameon, framealpha, fancybox, shadow)
凡例の枠に関連する設定をします
frameon: 凡例の枠の表示framealpha:凡例の透明度。0~1の数値で指定fancybox: 凡例の枠の丸い縁shadow: 凡例の影
凡例の枠の表示 (frameon)
frameon=Falseで凡例の枠を非表示にできます
# step4 凡例の設定
ax.legend(frameon=False)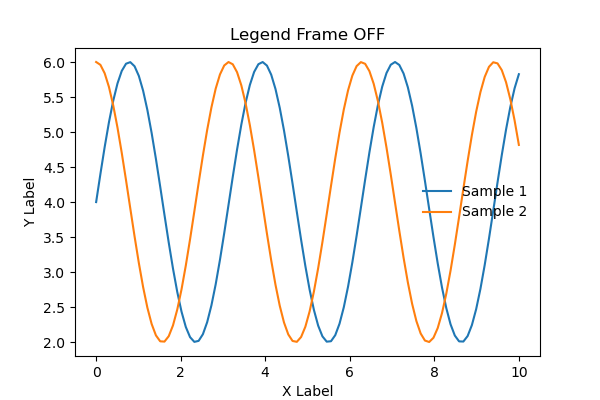
凡例の透明度 (framealpha)
framealphaは凡例の透明度を0~1で指定します
0 : 透明,1 : 非透明
# step4 凡例の設定
ax.legend(framealpha=1)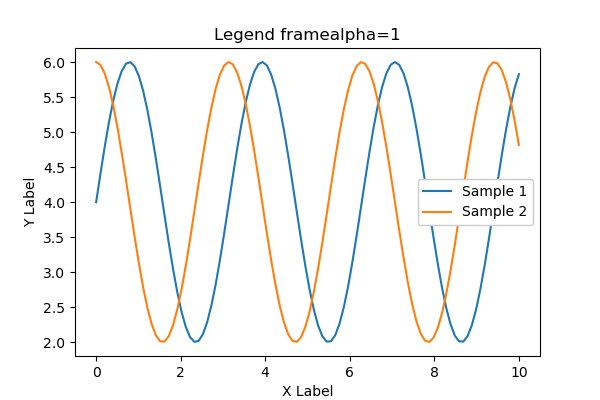
凡例の丸い縁 (fancybox)
fancybox=Falseで凡例の丸い縁をなくして,角がある四角形となります
# step4 凡例の設定
ax.legend(fancybox=False)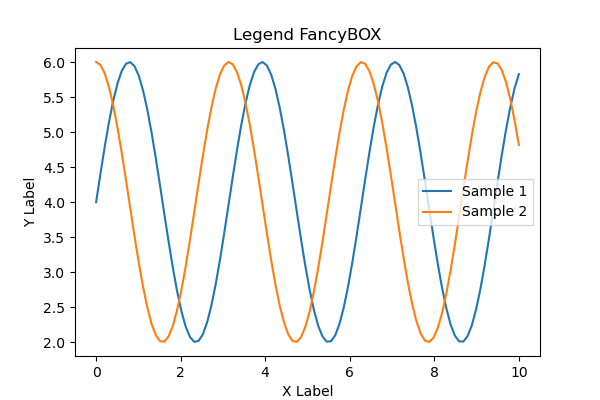
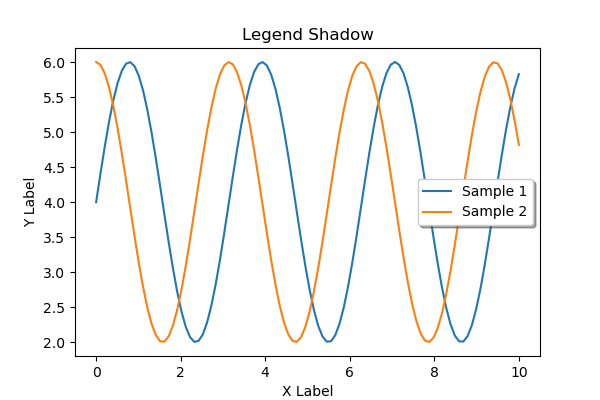
凡例の影 (shadow)
shadow=Trueで凡例に影をつけられます
# step4 凡例の設定
ax.legend(shadow=True)