【Matplotlib】軸の設定まとめ!目盛り,スケール,リミット(Axis)
\ 迷ったらまずTechAcademyの無料カウンセリング! /
Matplotlibで軸に関する設定は様々あるため,分からないことはよくあります。目盛り、スケール、リミットの設定について戸惑っていることでしょう。
この記事では、Matplotlibで軸をカスタマイズする方法を詳しく説明します。目盛りの設定、スケールの変更、軸の範囲の制御など、具体的な手順を紹介します。
記事を読み終えた後、Matplotlibを使ってグラフの軸を自在に設定できるようになります。これにより、データの可視化がさらに効果的に行えるようになります。
初心者向けのチュートリアルは下記記事を参考にしてください
グラフの構成
Matplotlibのグラフ構成は下図のようになっています。構成要素はおおきくFigure, Axes, Axis, Artistの4つですが,互いに含み合っているので少し複雑です
今回は特にAxesとAxisに注目して解説しています
グラフの構成要素
- 全体の入れ物の図 (Figure)
-
図全体です。すべての子Axesやタイトル,図の凡例,カラーバーなどに対応します。
Axesと組み合わせて書くと便利ですが,Figureのみでもグラフを描画することができます
- データを描画する図 (Axes)
-
データのプロット領域を含むFigureにあるArtistです
通常は2つ(3Dの場合は3つ)の
Axisオブジェクト(AxesとAxisの違いに注意)を含み,Axes内の目盛りと目盛りラベルを提供します。各Axesには,タイトル,xラベル,y ラベルもあります。 - 図の軸設定 (Axis)
-
図の軸に関するオブジェクトです。
スケールとリミットを設定し,目盛りと目盛りラベルを生成します。目盛りの位置は
Locatorオブジェクトによって決定され,目盛りラベルの文字列はFormatterによってフォーマットされます。 - 図のすべて(Artist)
-
基本的に,Figure上に見えるものはすべてArtistです(
Figure,Axes,Axisオブジェクトも)。Figure が呼び出されると,すべてのArtistが描画されます。

軸ラベル (Axes.set_xlabel, set_ylabel)
軸のラベルをAxes.set_xlabelとAxes.set_ylabelで設定できます
ax.set_xlabel('X Label'), ax.set_ylabel('Y Label')
- 引数
- 公式ドキュメント
下記のタブにコードとフローチャートで解説します
# step0 ライブラリの読み込み
import matplotlib.pyplot as plt
import numpy as np

# step1 データの作成
x = np.linspace(0, 10, 100)
y1 = 4 + 2 * np.sin(2 * x)
y2 = 4 + 2 * np.cos(2 * x)

# step2 グラフフレームの作成
fig, ax = plt.subplots(figsize=(6, 4))

# step3 グラフの描画
ax.plot(x, y1, 'o--')
ax.plot(x, y2, 'D--')

# step4 軸の設定
# 軸ラベル設定
ax.set_xlabel('X Label')
ax.set_ylabel('Y Label')

ax.set_title('Label')

# step5 Figureの呼び出し
plt.show()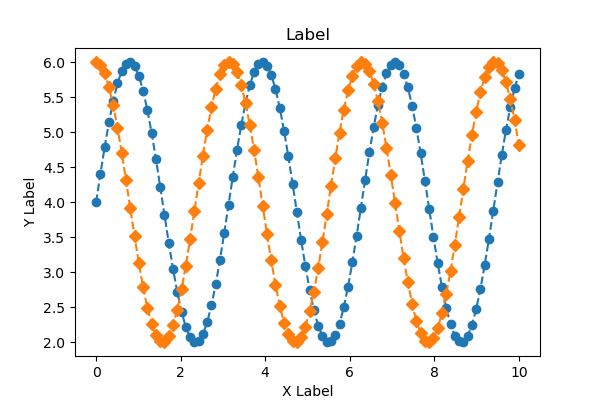
軸ラベルの軸からの距離 (labelpad)
目盛りと目盛りラベルを含む,軸のバウンディングボックスからの距離です
float値で指定し,デフォルトは4です
# step4 軸の設定
# 軸ラベル設定
ax.set_xlabel('X Label', labelpad=-10)
ax.set_ylabel('Y Labelpad=20', labelpad=20)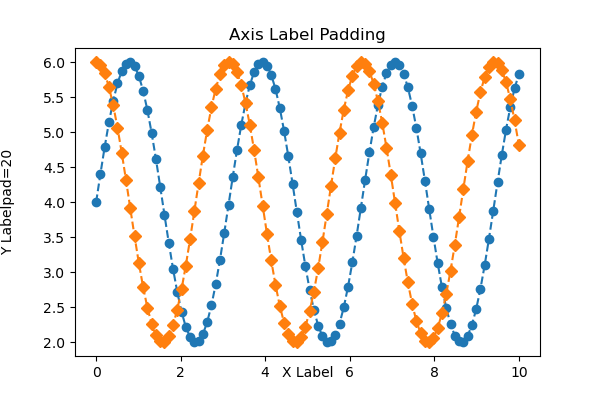
軸ラベルの位置 (loc)
軸ラベルの位置はAxes.set_xlabelとAxes.set_ylabelにlocを設定します
X label : loc=(‘left’, ‘center’, ‘right’)
Y label : loc=(‘bottom’, ‘center’, ‘top’)
# step4 軸の設定
# 軸ラベル設定
ax.set_xlabel('X Label', loc='left')
ax.set_ylabel('Y Label', loc='top')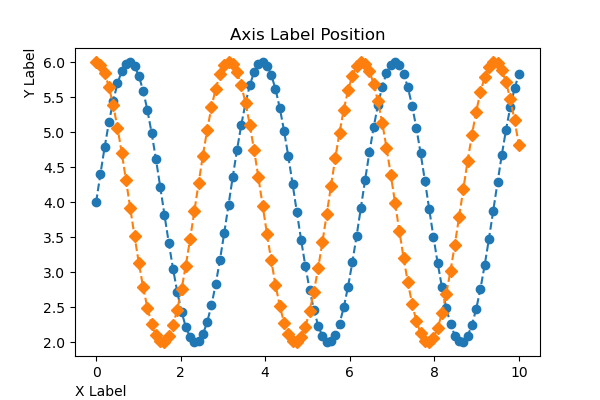
軸ラベルの外観 (Text)
Textクラスは軸ラベルの文字の外観を設定できます
X label : Times New Roman, イタリック体
Y label : 太字,サイズ16, 赤色
# step4 軸の設定
# 軸ラベル設定
ax.set_xlabel('X Label', fontfamily='Times New Roman', fontstyle='italic')
ax.set_ylabel('Y Label', fontweight='bold', fontsize=16, color='red') 
軸リミット (Axes.set_xlim, set_ylim)
軸の上限と下限をAxes.set_xlimとAxes.set_ylimで設定できます
ax.set_xlim(0, 8), ax.set_ylim(0, 8)
- 引数
-
- left, right or bottom, top (float) : グラフの座標の上限と下限.leftのみの指定もできます
- auto (True or False) : オートスケーリング.True はオン,False はオフ,None は未変更です
- xmin, xmax (float) : それぞれleftとrightに相当し,xminとleft,xmaxとrightの両方を渡すとエラーとなります
- 返値
-
- left, right or bottom, top
- 公式ドキュメント
下記のタブにコードとフローチャートで解説します
# step0 ライブラリの読み込み
import matplotlib.pyplot as plt
import numpy as np

# step1 データの作成
x = np.linspace(0, 10, 100)
y1 = 4 + 2 * np.sin(2 * x)
y2 = 4 + 2 * np.cos(2 * x)

# step2 グラフフレームの作成
fig, ax = plt.subplots(figsize=(6, 4))

# step3 グラフの描画
ax.plot(x, y1, 'o--')
ax.plot(x, y2, 'D--')

# step4 軸の設定
# 軸ラベル
ax.set_xlabel('X Label')
ax.set_ylabel('Y Label')

# 軸リミット
ax.set_xlim(0, 8)
ax.set_ylim(0, 8)

# タイトル
ax.set_title('Axis Limit')

# step5 Figureの呼び出し
plt.show()
上限か下限の片側のみ
Axes.set_xlimはleft,Axes.set_ylimはtopのみ指定します
ax.set_xlim(0), ax.set_ylim(None, 8)
# step4 軸の設定
# 軸リミット
ax.set_xlim(0)
ax.set_ylim(None, 8)
逆方向の軸, 減少軸
軸リミットの順序を反転させることで、減少軸を使用することができます。
ax.set_xlim(8, 0)
# step4 軸の設定
# 軸リミット
ax.set_xlim(8, 0)
ax.set_ylim(0, 8)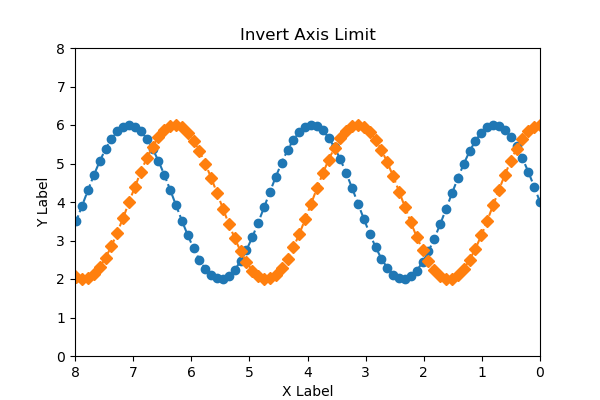
軸の対数スケール (Axes.xscale, yscale)
軸のスケールをAxes.set_xscaleとAxes.set_yscaleで設定できます
ax.set_xscale('linear'), ax.set_yscale('log')
下記のタブにコードとフローチャートで解説します
# step0 ライブラリのインストール
import matplotlib.pyplot as plt
import numpy as np

# step1 データの作成
x = np.linspace(0, 10, 100)
y1 = np.exp(1.2*x) + np.sin(2*x)
y2 = np.exp(x) + 2*np.cos(x)

# step2 グラフフレームの作成
fig, ax = plt.subplots(figsize=(6, 4), constrained_layout=True)

# step3 グラフの描画
ax.plot(x, y1)
ax.plot(x, y2)

# step4 軸ラベル,タイトルの設定
ax.set_xlabel('linear')
ax.set_ylabel('linear')
ax.set_title('Axis Scale')

# step5 スケールの設定
ax.set_xscale('linear')
ax.set_yscale('linear')

# step6 グラフの呼び出し
plt.show()
# step5 スケールの設定
ax.set_xscale('log')
ax.set_yscale('linear')
# step5 スケールの設定
ax.set_xscale('linear')
ax.set_yscale('log')
# step5 スケールの設定
ax.set_xscale('log')
ax.set_yscale('log')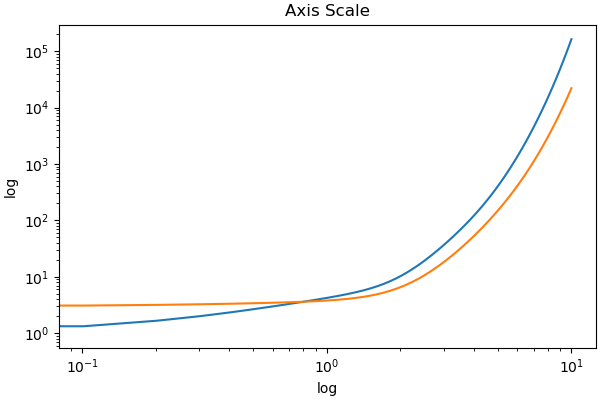
目盛り (Axes.set_xticks, Axes.set_yticks)
目盛りの位置や文字列表示などをAxes.set_xticks, Axes.set_yticksで設定できます
ax.set_xticks([0, 1, 2, 3, 4, 5, 6, 7, 8]), ax.set_yticks([0, 4, 8])
- 引数
- 公式ドキュメント
# step0 ライブラリの読み込み
import matplotlib.pyplot as plt
import numpy as np

# step1 データの作成
x = np.linspace(0, 10, 100)
y1 = 4 + 2 * np.sin(2 * x)
y2 = 4 + 2 * np.cos(2 * x)

# step2 グラフフレームの作成
fig, ax = plt.subplots(figsize=(6, 4))

# step3 グラフの描画
ax.plot(x, y1, 'o--')
ax.plot(x, y2, 'D--')

# step4 軸の設定
# 軸ラベル
ax.set_xlabel('X Label')
ax.set_ylabel('Y Label')
# 軸リミット
ax.set_xlim(0, 8)
ax.set_ylim(0, 8)

# 目盛り
ax.set_xticks([0, 1, 2, 3, 4, 5, 6, 7, 8])
ax.set_yticks([0, 4, 8])
ax.set_title('Axis Ticks')

# step5 Figureの呼び出し
plt.show()
文字列の目盛り (labels)
labelsは目盛りを文字列にします
文字列の位置は先ほど使用したticksで決定されます
# step4 軸の設定
# 目盛り
ax.set_xticks(
    [0, 1, 2, 3, 4, 5, 6, 7, 8],
    labels=['a', 'b', 'c', 'e', 'f', 'g','h', 'i', 'j']
)
ax.set_yticks([0, 4, 8])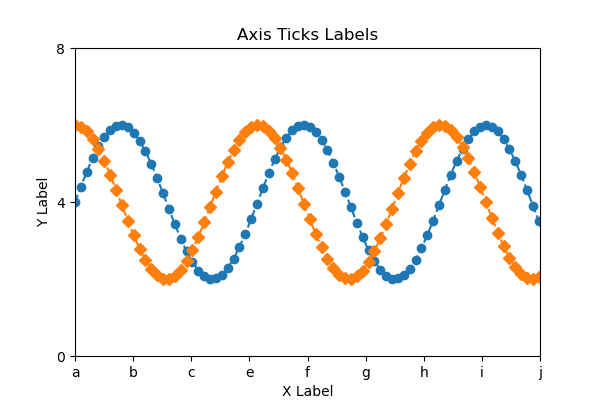
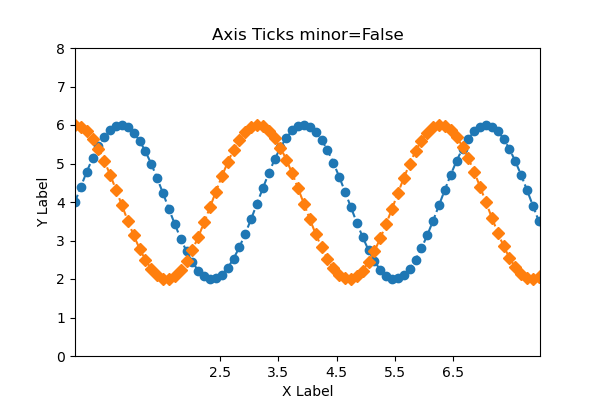
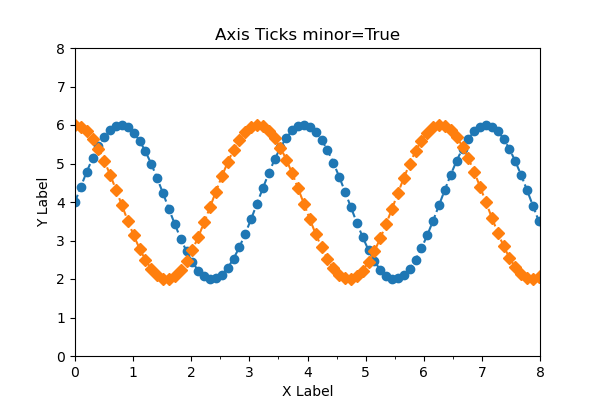
マイナー目盛り (minor)
Axes.set_xticksはデフォルトでメジャー目盛りを指定し,minor=Trueでマイナー目盛りを指定できます
下記数値を指定したときに,メジャー目盛りとマイナー目盛りで比較しました
ax.set_xticks([2.5, 3.5, 4.5, 5.5, 6.5])
# step4 軸の設定
# 目盛り
ax.set_xticks([2.5, 3.5, 4.5, 5.5, 6.5])メジャー目盛りminor=False
マイナー目盛りminor=True
目盛りのカスタム (Axes.tick_params)
Axes.tick_paramsは目盛り,目盛りラベル,グリッド線の外観を変更します。
- 引数
-
- axis (‘x’, ‘y’ or ‘both’) : パラメータを適用する軸。
- which (‘major’, ‘minor’, ‘both’) : パラメータを適用する目盛りのグループ。
- reset (True or False) : 目盛りを更新する前にデフォルトにリセットするかどうか。
- 公式ドキュメント
本記事ではいくつかのカスタムのみ紹介します
x軸 : 目盛りの色と向き,幅
y軸 : ラベルの色とサイズ
# step4 軸の設定
# x軸,目盛りの色と向き,幅
ax.tick_params('x', color='red', direction='in', width=5)
# y軸,ラベルの色とサイズ
ax.tick_params('y', labelcolor='red', labelsize=16)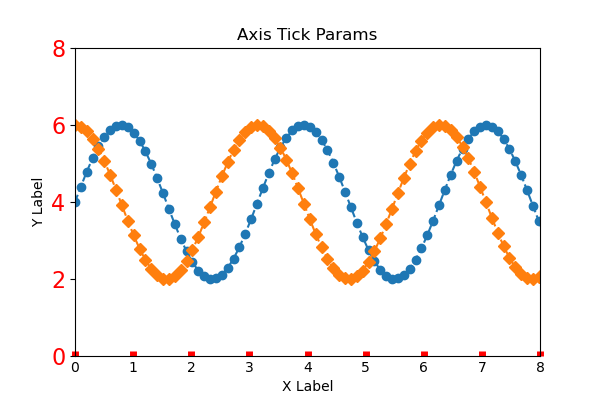
軸の追加と削除
軸を追加したり,削除する方法について解説します
Pythonコードのstep1データの作成とstep2グラフフレームの作成は前章までと同じです
軸の追加 (Axes.twinx)
Matplotlibで軸を増やすには,Axes.twinx関数(or twiny)を使います
twin1 = ax.twinx()
- 返値
-
Axes
- 公式ドキュメント
# step3 y軸の作成
twin1 = ax.twinx()

# step4 グラフの描画
ax.plot(x, y1, color='C0')
twin1.plot(x, y2, color='C1')

# step4 軸の設定
# 軸ラベル
ax.set_xlabel('X label')
ax.set_ylabel('Y1')
twin1.set_ylabel('Y2')
# 軸の色
ax.tick_params(axis='y', colors='C0')
twin1.tick_params(axis='y', colors='C1')

ax.set_title('Twin Axis Ticks')

# step5 Figureの呼び出し
plt.show()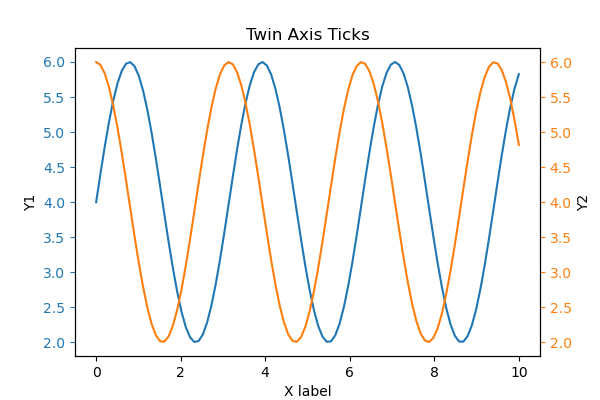
枠の削除
グラフの枠はspinesを使用します
top, right, left, bottomから非表示にする枠を指定しますax.spines[['top', 'right']].set_visible(False)
- 親クラス
-
Patch : フェイスカラーとエッジカラーを持つ2DArtist
- 公式ドキュメント
# step3 グラフの描画
ax.plot(x, y1, 'o--')
ax.plot(x, y2, 'D--')

# step4 軸の設定
# 枠の削除
ax.spines[['top', 'right']].set_visible(False)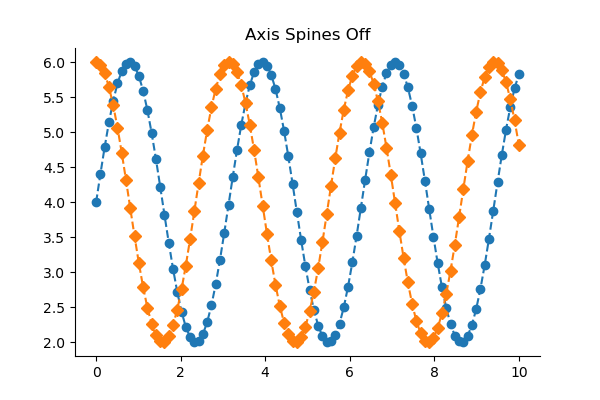
目盛りの削除
グラフの目盛りはAxisクラスを使用します
ax.yaxis.set_visible(False)
- 引数
- 親クラス
-
- matplotlib.axis.Axis : Axis オブジェクト
- 公式ドキュメント
# step3 グラフの描画
ax.plot(x, y1, 'o--')
ax.plot(x, y2, 'D--')

# step4 軸の設定
# y軸目盛りの削除
ax.yaxis.set_visible(False)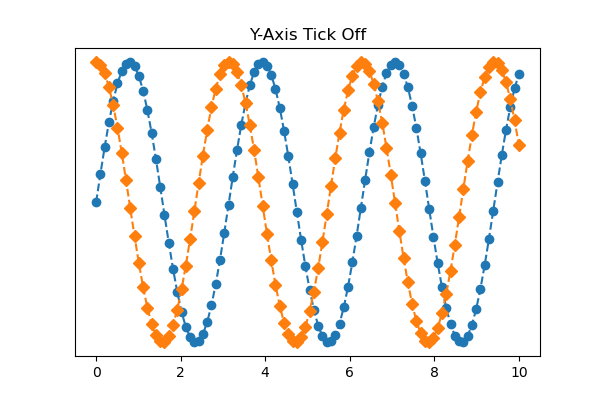
y軸目盛りと枠の削除
枠の削除 : ax.spines[['top', 'right', 'left']].set_visible(False)
目盛りの削除 : ax.yaxis.set_visible(False)
# step3 グラフの描画
ax.plot(x, y1, 'o--')
ax.plot(x, y2, 'D--')

# step4 軸の設定
# y軸目盛りの削除
ax.yaxis.set_visible(False)
# 枠の削除
ax.spines[['top', 'right', 'left']].set_visible(False)
全目盛りと枠の一括削除
Axes.set_axis_off()はxとyの軸関連のすべてを削除します
# step3 グラフの描画
ax.plot(x, y1, 'o--')
ax.plot(x, y2, 'D--')

# step4 軸の設定
# 軸すべての削除
ax.set_axis_off()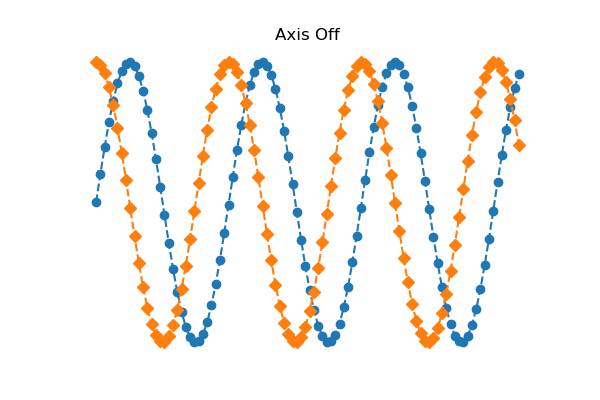
参考文献
一括でグラフの設定をしたい
Axis Label Position
Plots with different scales
Invert Axes