
Are you confused about how to plot graphs on HTML using Python?
If you want to display a graph on a web page, you can achieve this by combining several tools: PyScript, Matplotlib, and Bootstrap!
This article explains how to combine PyScript, Matplotlib, and Bootstrap to plot graphs in HTML using Python, allowing you to display beautiful graphs on your web pages.
After reading this article, you will be able to utilize PyScript and Matplotlib for your own web projects and implement attractive graphs in conjunction with Bootstrap.
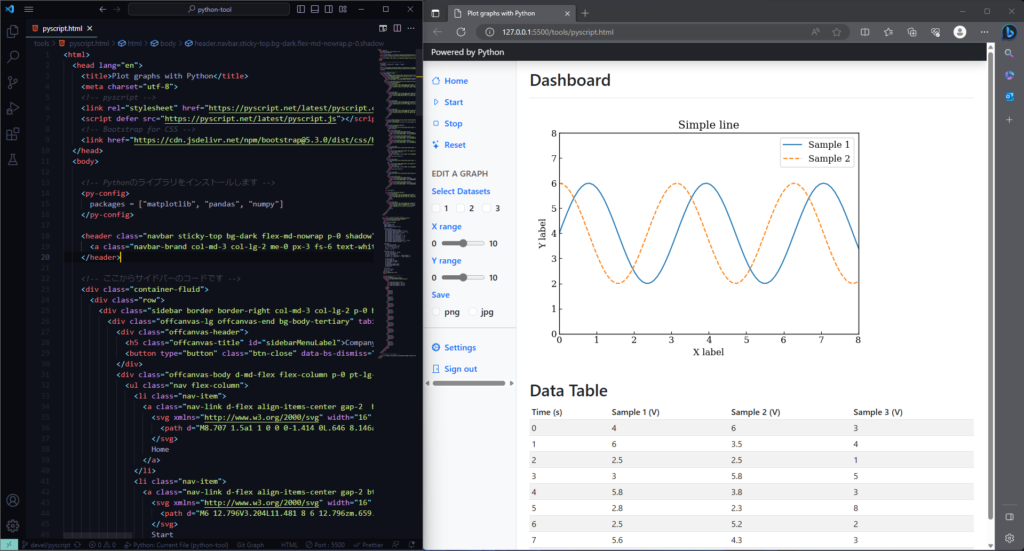
Completed Codes and Results: Intro
First, here is the HTML code and web page results of the dashboard screen created by combining PyScript, Matplotlib, and Bootstrap
The functions of each are as follows, for more details, please refer to the following chapters
- Pyscript
-
Library that makes Python code directly executable in the browser
Add interactive Python REPL to HTML and share dashboards
- Matplotlib
-
Data visualization library for Python.
Easily create graphs and plots to visually represent data. It is easy to use even for beginners.
- Bootstrap
-
Open source web design framework
Easily create beautiful web pages with HTML/CSS/JS and easy to use for beginners
<html>
  <head lang="en">
    <title>Plot graphs with Python</title>
    <meta charset="utf-8">
    <!-- CDN for pyscript -->
    <link rel="stylesheet" href="https://pyscript.net/latest/pyscript.css" />
    <script defer src="https://pyscript.net/latest/pyscript.js"></script>
    <!-- CDN for Bootstrap CSS -->
    <link href="https://cdn.jsdelivr.net/npm/bootstrap@5.3.0/dist/css/bootstrap.min.css" rel="stylesheet" integrity="sha384-9ndCyUaIbzAi2FUVXJi0CjmCapSmO7SnpJef0486qhLnuZ2cdeRhO02iuK6FUUVM" crossorigin="anonymous">
  </head>
  <body>

    <!-- Install Python libraries -->
    <py-config>
      packages = ["matplotlib", "pandas", "numpy"]
    </py-config>

    <header class="navbar sticky-top bg-dark flex-md-nowrap p-0 shadow" data-bs-theme="dark">
      <a class="navbar-brand col-md-3 col-lg-2 me-0 px-3 fs-6 text-white" href="#">Powered by Python</a>
    </header>

    <!-- Here is the code for the sidebar -->
    <div class="container-fluid">
      <div class="row">
        <div class="sidebar border border-right col-md-3 col-lg-2 p-0 bg-body-tertiary">
          <div class="offcanvas-lg offcanvas-end bg-body-tertiary" tabindex="-1" id="sidebarMenu" aria-labelledby="sidebarMenuLabel">
            <div class="offcanvas-header">
              <h5 class="offcanvas-title" id="sidebarMenuLabel">Company name</h5>
              <button type="button" class="btn-close" data-bs-dismiss="offcanvas" data-bs-target="#sidebarMenu" aria-label="Close"></button>
            </div>
            <div class="offcanvas-body d-md-flex flex-column p-0 pt-lg-3 overflow-y-auto fw-bold">
              <ul class="nav flex-column">
                <li class="nav-item">
                  <a class="nav-link d-flex align-items-center gap-2  btn btn-light" aria-current="page" href="#">
                    <svg xmlns="http://www.w3.org/2000/svg" width="16" height="16" fill="currentColor" class="bi bi-house" viewBox="0 0 16 16">
                      <path d="M8.707 1.5a1 1 0 0 0-1.414 0L.646 8.146a.5.5 0 0 0 .708.708L2 8.207V13.5A1.5 1.5 0 0 0 3.5 15h9a1.5 1.5 0 0 0 1.5-1.5V8.207l.646.647a.5.5 0 0 0 .708-.708L13 5.793V2.5a.5.5 0 0 0-.5-.5h-1a.5.5 0 0 0-.5.5v1.293L8.707 1.5ZM13 7.207V13.5a.5.5 0 0 1-.5.5h-9a.5.5 0 0 1-.5-.5V7.207l5-5 5 5Z"/>
                    </svg>
                    Home
                  </a>
                </li>
                <li class="nav-item">
                  <a class="nav-link d-flex align-items-center gap-2 btn btn-light" href="#">
                    <svg xmlns="http://www.w3.org/2000/svg" width="16" height="16" fill="currentColor" class="bi bi-caret-right" viewBox="0 0 16 16">
                      <path d="M6 12.796V3.204L11.481 8 6 12.796zm.659.753 5.48-4.796a1 1 0 0 0 0-1.506L6.66 2.451C6.011 1.885 5 2.345 5 3.204v9.592a1 1 0 0 0 1.659.753z"/>
                    </svg>
                    Start
                  </a>
                </li>
                <li class="nav-item">
                  <a class="nav-link d-flex align-items-center gap-2 btn btn-light" href="#">
                    <svg xmlns="http://www.w3.org/2000/svg" width="16" height="16" fill="currentColor" class="bi bi-stop" viewBox="0 0 16 16">
                      <path d="M3.5 5A1.5 1.5 0 0 1 5 3.5h6A1.5 1.5 0 0 1 12.5 5v6a1.5 1.5 0 0 1-1.5 1.5H5A1.5 1.5 0 0 1 3.5 11V5zM5 4.5a.5.5 0 0 0-.5.5v6a.5.5 0 0 0 .5.5h6a.5.5 0 0 0 .5-.5V5a.5.5 0 0 0-.5-.5H5z"/>
                    </svg>
                    Stop
                  </a>
                </li>
                <li class="nav-item">
                  <a class="nav-link d-flex align-items-center gap-2 btn btn-light" href="#">
                    <svg xmlns="http://www.w3.org/2000/svg" width="16" height="16" fill="currentColor" class="bi bi-stars" viewBox="0 0 16 16">
                      <path d="M7.657 6.247c.11-.33.576-.33.686 0l.645 1.937a2.89 2.89 0 0 0 1.829 1.828l1.936.645c.33.11.33.576 0 .686l-1.937.645a2.89 2.89 0 0 0-1.828 1.829l-.645 1.936a.361.361 0 0 1-.686 0l-.645-1.937a2.89 2.89 0 0 0-1.828-1.828l-1.937-.645a.361.361 0 0 1 0-.686l1.937-.645a2.89 2.89 0 0 0 1.828-1.828l.645-1.937zM3.794 1.148a.217.217 0 0 1 .412 0l.387 1.162c.173.518.579.924 1.097 1.097l1.162.387a.217.217 0 0 1 0 .412l-1.162.387A1.734 1.734 0 0 0 4.593 5.69l-.387 1.162a.217.217 0 0 1-.412 0L3.407 5.69A1.734 1.734 0 0 0 2.31 4.593l-1.162-.387a.217.217 0 0 1 0-.412l1.162-.387A1.734 1.734 0 0 0 3.407 2.31l.387-1.162zM10.863.099a.145.145 0 0 1 .274 0l.258.774c.115.346.386.617.732.732l.774.258a.145.145 0 0 1 0 .274l-.774.258a1.156 1.156 0 0 0-.732.732l-.258.774a.145.145 0 0 1-.274 0l-.258-.774a1.156 1.156 0 0 0-.732-.732L9.1 2.137a.145.145 0 0 1 0-.274l.774-.258c.346-.115.617-.386.732-.732L10.863.1z"/>
                    </svg>
                    Reset
                  </a>
                </li>
              </ul>

              <h6 class="sidebar-heading d-flex justify-content-between align-items-center px-3 mt-4 mb-1 text-body-secondary text-uppercase">
                <span>Edit a graph</span>
                <a class="link-secondary" href="#" aria-label="Add a new report">
                </a>
              </h6>
              <ul class="nav flex-column mb-auto">
                <li class="nav-item">
                  <a class="nav-link d-flex align-items-center gap-2" href="#">
                    Select Datasets
                  </a>
                  <div class="d-flex mx-3">
                    <div class="form-check form-check-inline">
                      <input class="form-check-input" type="checkbox" id="inlineCheckbox1" value="option1">
                      <label class="form-check-label" for="inlineCheckbox1">1</label>
                    </div>
                    <div class="form-check form-check-inline">
                      <input class="form-check-input" type="checkbox" id="inlineCheckbox2" value="option2">
                      <label class="form-check-label" for="inlineCheckbox2">2</label>
                    </div>
                    <div class="form-check form-check-inline">
                      <input class="form-check-input" type="checkbox" id="inlineCheckbox3" value="option3">
                      <label class="form-check-label" for="inlineCheckbox3">3</label>
                    </div>
                  </div>
                </li>
                <li class="nav-item">
                  <a class="nav-link d-flex align-items-center gap-2" href="#">
                    X range
                  </a>
                  <div class="d-flex align-items-center col-8 gap-2 mx-3">
                    <div class="col-1">0</div>
                    <div class="col">
                      <input type="range" class="w-100" id="customRange1">
                    </div>
                    <div class="col-1">10</div>
                  </div>
                </li>
                <li class="nav-item">
                  <a class="nav-link d-flex align-items-center gap-2" href="#">
                    Y range
                  </a>
                  <div class="d-flex align-items-center col-8 gap-2 mx-3">
                    <div class="col-1">0</div>
                    <div class="col">
                      <input type="range" class="w-100" id="customRange1">
                    </div>
                    <div class="col-1">10</div>
                  </div>
                </li>
                <li class="nav-item">
                  <a class="nav-link d-flex align-items-center gap-2 btn btn-light" href="#">
                    Save
                  </a>
                  <div class="d-flex mx-3">
                    <div class="form-check form-check-inline">
                      <input class="form-check-input" type="radio" name="inlineRadioOptions" id="inlineRadio1" value="option1">
                      <label class="form-check-label" for="inlineRadio1">png</label>
                    </div>
                    <div class="form-check form-check-inline">
                      <input class="form-check-input" type="radio" name="inlineRadioOptions" id="inlineRadio2" value="option2">
                      <label class="form-check-label" for="inlineRadio2">jpg</label>
                    </div>
                  </div>
                </li>
              </ul>

              <hr class="my-3">

              <ul class="nav flex-column mb-auto">
                <li class="nav-item">
                  <a class="nav-link d-flex align-items-center gap-2" href="#">
                    <svg xmlns="http://www.w3.org/2000/svg" width="16" height="16" fill="currentColor" class="bi bi-gear-wide-connected" viewBox="0 0 16 16">
                      <path d="M7.068.727c.243-.97 1.62-.97 1.864 0l.071.286a.96.96 0 0 0 1.622.434l.205-.211c.695-.719 1.888-.03 1.613.931l-.08.284a.96.96 0 0 0 1.187 1.187l.283-.081c.96-.275 1.65.918.931 1.613l-.211.205a.96.96 0 0 0 .434 1.622l.286.071c.97.243.97 1.62 0 1.864l-.286.071a.96.96 0 0 0-.434 1.622l.211.205c.719.695.03 1.888-.931 1.613l-.284-.08a.96.96 0 0 0-1.187 1.187l.081.283c.275.96-.918 1.65-1.613.931l-.205-.211a.96.96 0 0 0-1.622.434l-.071.286c-.243.97-1.62.97-1.864 0l-.071-.286a.96.96 0 0 0-1.622-.434l-.205.211c-.695.719-1.888.03-1.613-.931l.08-.284a.96.96 0 0 0-1.186-1.187l-.284.081c-.96.275-1.65-.918-.931-1.613l.211-.205a.96.96 0 0 0-.434-1.622l-.286-.071c-.97-.243-.97-1.62 0-1.864l.286-.071a.96.96 0 0 0 .434-1.622l-.211-.205c-.719-.695-.03-1.888.931-1.613l.284.08a.96.96 0 0 0 1.187-1.186l-.081-.284c-.275-.96.918-1.65 1.613-.931l.205.211a.96.96 0 0 0 1.622-.434l.071-.286zM12.973 8.5H8.25l-2.834 3.779A4.998 4.998 0 0 0 12.973 8.5zm0-1a4.998 4.998 0 0 0-7.557-3.779l2.834 3.78h4.723zM5.048 3.967c-.03.021-.058.043-.087.065l.087-.065zm-.431.355A4.984 4.984 0 0 0 3.002 8c0 1.455.622 2.765 1.615 3.678L7.375 8 4.617 4.322zm.344 7.646.087.065-.087-.065z"/>
                    </svg>
                    Settings
                  </a>
                </li>
                <li class="nav-item">
                  <a class="nav-link d-flex align-items-center gap-2" href="#">
                    <svg xmlns="http://www.w3.org/2000/svg" width="16" height="16" fill="currentColor" class="bi bi-door-closed" viewBox="0 0 16 16">
                      <path d="M3 2a1 1 0 0 1 1-1h8a1 1 0 0 1 1 1v13h1.5a.5.5 0 0 1 0 1h-13a.5.5 0 0 1 0-1H3V2zm1 13h8V2H4v13z"/>
                      <path d="M9 9a1 1 0 1 0 2 0 1 1 0 0 0-2 0z"/>
                    </svg>
                    Sign out
                  </a>
                </li>
              </ul>
            </div>
          </div>
        </div>

        <!-- Here is the code for the dashboard -->
        <main class="col-md-9 ms-sm-auto col-lg-10 px-md-4">
          <div class="pt-3 pb-2 mb-3 border-bottom">
            <h1 class="h2">Dashboard</h1>
          </div>
          <div class="my-4 w-100">
            <py-script>
              import pandas as pd
              import numpy as np
              import matplotlib.pyplot as plt

              def plt_style():
                plt.rcParams['figure.autolayout'] = True
                plt.rcParams['figure.figsize'] = [6.4, 4.8]
                plt.rcParams['font.family'] ='serif'
                plt.rcParams['font.size'] = 12
                plt.rcParams['xtick.direction'] = 'in'
                plt.rcParams['ytick.direction'] = 'in'
                plt.rcParams['axes.linewidth'] = 1.0
                plt.rcParams['errorbar.capsize'] = 6
                plt.rcParams['lines.markersize'] = 6
                plt.rcParams['lines.markerfacecolor'] = 'white'
                plt.rcParams['mathtext.fontset'] = 'cm'

              def data():
                x = np.linspace(0, 10, 100)
                y1 = 4 + 2 * np.sin(2 * x)
                y2 = 4 + 2 * np.cos(2 * x)
                return x, y1, y2

              def plot(x, y1, y2):
                fig, ax = plt.subplots()

                ax.plot(x, y1, linestyle='-', label='Sample 1')
                ax.plot(x, y2, linestyle='--', label='Sample 2')

                ax.set_xlim(0, 8)
                ax.set_ylim(0, 8)
                ax.set_xlabel('X label')
                ax.set_ylabel('Y label')
                ax.legend()
                ax.set_title('Simple line')

                display(fig)

              plt_style()
              x, y1, y2 = data()
              plot(x, y1, y2)
            </py-script>
            <div id="graph-area"></div>
          </div>

          <!-- Here is the code for the data table -->
          <h2>Data Table</h2>
          <div class="table-responsive small">
            <table class="table table-striped table-sm">
              <thead>
                <tr>
                  <th scope="col">Time (s)</th>
                  <th scope="col">Sample 1 (V)</th>
                  <th scope="col">Sample 2 (V)</th>
                  <th scope="col">Sample 3 (V)</th>
                </tr>
              </thead>
              <tbody>
                <tr>
                  <td>0</td>
                  <td>4</td>
                  <td>6</td>
                  <td>3</td>
                </tr>
                <tr>
                  <td>1</td>
                  <td>6</td>
                  <td>3.5</td>
                  <td>4</td>
                </tr>
                <tr>
                  <td>2</td>
                  <td>2.5</td>
                  <td>2.5</td>
                  <td>1</td>
                </tr>
                <tr>
                  <td>3</td>
                  <td>3</td>
                  <td>5.8</td>
                  <td>5</td>
                </tr>
                <tr>
                  <td>4</td>
                  <td>5.8</td>
                  <td>3.8</td>
                  <td>3</td>
                </tr>
                <tr>
                  <td>5</td>
                  <td>2.8</td>
                  <td>2.3</td>
                  <td>8</td>
                </tr>
                <tr>
                  <td>6</td>
                  <td>2.5</td>
                  <td>5.2</td>
                  <td>2</td>
                </tr>
                <tr>
                  <td>7</td>
                  <td>5.6</td>
                  <td>4.3</td>
                  <td>3</td>
                </tr>
                <tr>
                  <td>8</td>
                  <td>3</td>
                  <td>2.2</td>
                  <td>6</td>
                </tr>
              </tbody>
            </table>
          </div>
        </main>
      </div>
    </div>
    <!-- CDn for Bootstrap Javascript -->
    <!-- Place just before closing the body -->
    <script src="https://cdn.jsdelivr.net/npm/bootstrap@5.3.0/dist/js/bootstrap.bundle.min.js" integrity="sha384-geWF76RCwLtnZ8qwWowPQNguL3RmwHVBC9FhGdlKrxdiJJigb/j/68SIy3Te4Bkz" crossorigin="anonymous"></script>
  </body>
</html>
Build a VSCode Environment: Prep. Step 0
Development with pyscript uses HTML and the results are viewed in a browser.
Therefore, the development environment must support HTML as well as Python.
This article briefly describes how to set up an HTML development environment in Visual Studio Code (VSCode).
Install Live Server as an extension
Live Server is installed by searching for it in Extensions on the left sidebar.
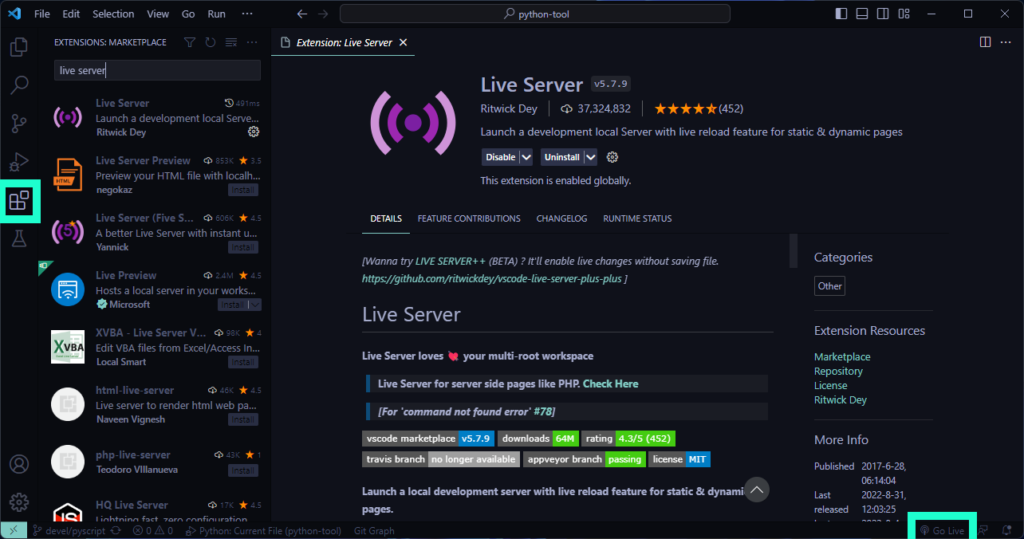
Updates the browser in real time with Live Server
Live Server starts when you select HTML and click Go Live
This should launch your browser as shown below and refresh each time you save the HTML file
Introduce PyScript: Easy Step 1
PyScript can be easily deployed in HTML using a CDN to write Python code
First, add the CDN for PyScript in the <head> tag
Next, add <py-script>tag inside <body> tag to write Python code
Additional Codes
CDN for PyScript <head>
<link rel="stylesheet" href="https://pyscript.net/latest/pyscript.css" />
<script defer src="https://pyscript.net/latest/pyscript.js"></script>
Tag for writing Python code <body>
<py-script>
    # Write your Python code in this
    print('Hello, World!')
</py-script>
<html>
<head lang="en">
<title>Plot graphs with Python</title>
<meta charset="utf-8">
<!-- CDN for pyscript -->
<link rel="stylesheet" href="https://pyscript.net/latest/pyscript.css" />
<script defer src="https://pyscript.net/latest/pyscript.js"></script>
</head>
<body>
<py-script>
# Write your Python code in this
print('Hello, World!')
</py-script>
</body>
</html>Plot graphs with Matplotlib: Extra Step 2
Now that we are ready to write Python code in the previous chapter, I will explain how to plot graphs in Matplotlib.
Install Python libraries
To use Python libraries like Matplotlib, preload them with the <py-config> tag
In this article, I loaded Matplotlib, pandas, and numpy
Additional Codes
Python Libraries <body>
<py-config>
  packages = ["matplotlib", "pandas", "numpy"]
</py-config>
<body>
<!-- Install Python libraries -->
<py-config>
packages = ["matplotlib", "pandas", "numpy"]
</py-config>
<py-script>
# Write your Python code in this
</py-script>
<div id="graph-area"></div>
</body>Write Python code
The difference in the Python code is the last statement to display the graph, which uses display(fig)
The following tabs explain the code and flowchart
import pandas as pd
import numpy as np
import matplotlib.pyplot as plt

def plt_style():
    # step1 Format a graph design
    plt.rcParams['figure.autolayout'] = True
    plt.rcParams['figure.figsize'] = [6.4, 4.8]
    plt.rcParams['font.family'] ='serif'
    plt.rcParams['font.size'] = 12
    plt.rcParams['xtick.direction'] = 'in'
    plt.rcParams['ytick.direction'] = 'in'
    plt.rcParams['axes.linewidth'] = 1.0
    plt.rcParams['errorbar.capsize'] = 6
    plt.rcParams['lines.markersize'] = 6
    plt.rcParams['lines.markerfacecolor'] = 'white'
    plt.rcParams['mathtext.fontset'] = 'cm'

def data():
    # step2 Create data
    x = np.linspace(0, 10, 100)
    y1 = 4 + 2 * np.sin(2 * x)
    y2 = 4 + 2 * np.cos(2 * x)
    return x, y1, y2

def plot(x, y1, y2):
    # step3 Create graph frames
    fig, ax = plt.subplots()

    # step4 Plot line charts
    ax.plot(x, y1, linestyle='-', label='Sample 1')
    ax.plot(x, y2, linestyle='--', label='Sample 2')

    ax.set_xlim(0, 8)
    ax.set_ylim(0, 8)
    ax.set_xlabel('X label')
    ax.set_ylabel('Y label')
    ax.legend()
    ax.set_title('Simple line')

    # step5 Display graphs on HTML
    display(fig)

# Execute each function
plt_style()
x, y1, y2 = data()
plot(x, y1, y2)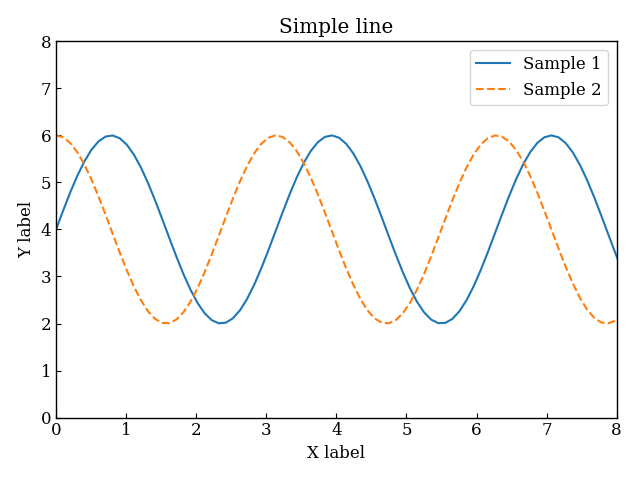
Web Design with Bootstrap: Fascinating Step 3
Bootstrap was used as a framework for easy and fast web design
Bootstrap can be easily implemented in HTML using a CDN
First, add CDN for CSS in <head> tag
Next, add a CDN for JavaScript just before the end of the <body> tag
I don’t explain the design, but this article is based on this theme
Additional Codes
CDN for Bootstrap CSS <head>
<link href="https://cdn.jsdelivr.net/npm/bootstrap@5.3.0/dist/css/bootstrap.min.css" rel="stylesheet" integrity="sha384-9ndCyUaIbzAi2FUVXJi0CjmCapSmO7SnpJef0486qhLnuZ2cdeRhO02iuK6FUUVM" crossorigin="anonymous">CDn for Bootstrap JavaScript <body>
<script src="https://cdn.jsdelivr.net/npm/bootstrap@5.3.0/dist/js/bootstrap.bundle.min.js" integrity="sha384-geWF76RCwLtnZ8qwWowPQNguL3RmwHVBC9FhGdlKrxdiJJigb/j/68SIy3Te4Bkz" crossorigin="anonymous"></script><html>
<head lang="en">
<title>Plot graphs with Python</title>
<meta charset="utf-8">
<!-- CDN for pyscript -->
<link rel="stylesheet" href="https://pyscript.net/latest/pyscript.css" />
<script defer src="https://pyscript.net/latest/pyscript.js"></script>
<!-- CDN for Bootstrap CSS -->
<link href="https://cdn.jsdelivr.net/npm/bootstrap@5.3.0/dist/css/bootstrap.min.css" rel="stylesheet" integrity="sha384-9ndCyUaIbzAi2FUVXJi0CjmCapSmO7SnpJef0486qhLnuZ2cdeRhO02iuK6FUUVM" crossorigin="anonymous">
</head>
<body>
<!-- Install Python libraries -->
<py-config>
packages = ["matplotlib", "pandas", "numpy"]
</py-config>
<py-script>
# Write your Python code in this
</py-script>
<div id="graph-area"></div>
<!-- CDN for Bootstrap Javascript -->
<!-- Place just before closing the body -->
<script src="https://cdn.jsdelivr.net/npm/bootstrap@5.3.0/dist/js/bootstrap.bundle.min.js" integrity="sha384-geWF76RCwLtnZ8qwWowPQNguL3RmwHVBC9FhGdlKrxdiJJigb/j/68SIy3Te4Bkz" crossorigin="anonymous"></script>
</body>
</html>References
Pyscript
Matplotlib
Bootstrap
Comments