
Are you having trouble visualizing time series data? If you don’t know how to accurately display time series graphs, you may be missing patterns and trends in your data!
In this article, I will show you how to easily graph time series data of datetime type by utilizing Matplotlib’s plot_date function.
You will be able to create accurate and beautiful time series graphs for your own projects and analyses. In addition, you will learn how to customize and style your graphs!
This article explains in detail how to use Matplotlib’s plot_date function with concrete code and graphs.
Create date lists and stock price data
Time series graphs use a list of dates and a list of numbers of type datetime
In this article, we have created weekly date data from January 2021 to June 2021.
The list of numbers simulates the stock price lists of three companies.
import datetime
import matplotlib.pyplot as plt
import matplotlib.dates as mdates

# step1 Create data
# Weekly date data from January 2021 to June 2021
start_date = datetime.datetime(2021, 1, 1)
end_date = datetime.datetime(2021, 3, 30)
# Create an empty list of dates
date_list = []
current_date = start_date
while current_date <= end_date:
    # Add date to empty list of dates
    date_list.append(current_date)
    # Update to a date one week later
    current_date += datetime.timedelta(weeks=1)

# Create a list of stock prices for 3 companies
# It's same number of elements as date_list
company1_stock_prices = [100, 105, 102, 110, 108, 115, 120, 118, 122, 125, 130, 128, 135]
company2_stock_prices = [80, 85, 88, 90, 92, 95, 100, 98, 102, 105, 110, 108, 105]
company3_stock_prices = [120, 125, 130, 135, 138, 140, 142, 145, 148, 150, 152, 155, 158]
The end result is a graph with a clearly organized time axis, as shown in the figure below

General Time Series Graphs (plot_date)
Plot a time series graph with the date list and stock price list created in the previous section
Time series graphs can be plotted with the plot_date function
- Parameters
-
- x (array) : The coordinates of the data points.
- y (array) : The coordinates of the data points.
- fmt (str) : The plot format string. Line type, line color, and marker can be specified at once
- tz (timezone string) : The time zone to use in labeling dates.
- xdate (True or False) : If True, the x-axis will be interpreted as Matplotlib dates.
- ydate (True or False) : If True, the y-axis will be interpreted as Matplotlib dates.
- Returns
-
- list of Line2D
- Official Documentation
# step2 Create graph frames
fig, ax = plt.subplots()
# step3 Plot time series graphs
ax.plot_date(date_list, company1_stock_prices, label='Company 1')
ax.plot_date(date_list, company2_stock_prices, label='Company 2')
ax.plot_date(date_list, company3_stock_prices, label='Company 3')

#step4 Custom time axis
ax.set_xlabel('Time label')
ax.set_ylabel('Y label')
ax.legend()
ax.set_title('Chart with time axis')

plt.show()
Set the Format (fmt)
fmt (format string) can specify marker, linetype, and color at once as follows
fmt = '[marker][line][color]'I created three different time series graphs using fmt
# step3 Plot time series graphs
ax.plot_date(date_list, company1_stock_prices, 'og--', label='Company 1')
ax.plot_date(date_list, company2_stock_prices, 'sr-.', label='Company 2')
ax.plot_date(date_list, company3_stock_prices, '*c:', label='Company 3')

plt.show()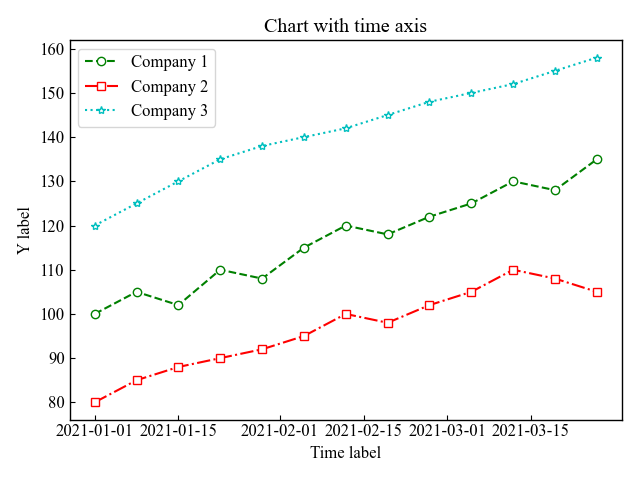
Change y-axis to time axis (xdate, ydate)
The plot_date function defaults to the x-axis as the time axis, but it is also possible to set the y-axis as the time axis
xdate=False, ydate=True, only the y-axis is a time axis
# step3 Plot time series graphs
ax.plot_date(company1_stock_prices, date_list, 'o-', xdate=False, ydate=True, label='Company 1')
ax.plot_date(company2_stock_prices, date_list, 'o-', xdate=False, ydate=True, label='Company 2')
ax.plot_date(company3_stock_prices, date_list, 'o-', xdate=False, ydate=True, label='Company 3')

plt.show()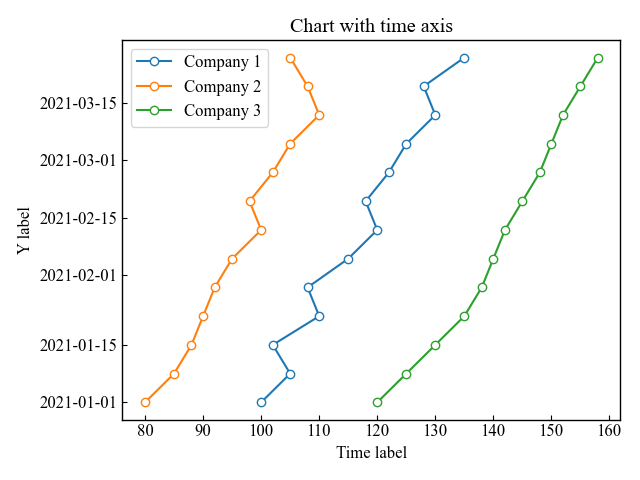
Set the tick marks on the scale. (AutoDateLocator)
The class AutoDateLocator sets the position, number, and increments of the time axis ticks.
- Attributes
-
- intervald (dict) : Mapping of tick frequencies to multiples allowed for that ticking.
self.intervald = { YEARLY : [1, 2, 4, 5, 10, 20, 40, 50, 100, 200, 400, 500, 1000, 2000, 4000, 5000, 10000], MONTHLY : [1, 2, 3, 4, 6], DAILY : [1, 2, 3, 7, 14, 21], HOURLY : [1, 2, 3, 4, 6, 12], MINUTELY: [1, 5, 10, 15, 30], SECONDLY: [1, 5, 10, 15, 30], MICROSECONDLY: [1, 2, 5, 10, 20, 50, 100, 200, 500, 1000, 2000, 5000, 10000, 20000, 50000, 100000, 200000, 500000, 1000000], } - Parameters
-
- tz (timezone string) : Ticks timezone.
- minticks (int) : The minimum number of ticks desired; controls whether ticks occur yearly, monthly, etc.
- maxticks (int) : The maximum number of ticks desired; controls the interval between ticks (ticking every other, every 3, etc.).
- interval_multiples (True or False) : Whether ticks should be chosen to be multiple of the interval, locking them to ‘nicer’ locations.
- Official Documentation
Less frequent ticking of the scale (minticks)
The minticks in the AutoDateLocator class can specify a minimum number of ticks
In this article, the minimum number of ticks is specified as 3
import matplotlib.dates as mdates

# step3 Plot time series graphs
ax.plot_date(date_list, company1_stock_prices, 'o-', label='Company 1')
ax.plot_date(date_list, company2_stock_prices, 'o-', label='Company 2')
ax.plot_date(date_list, company3_stock_prices, 'o-', label='Company 3')

#step4 Custom time axis
locator = mdates.AutoDateLocator(minticks=3)
ax.xaxis.set_major_locator(locator)

plt.show()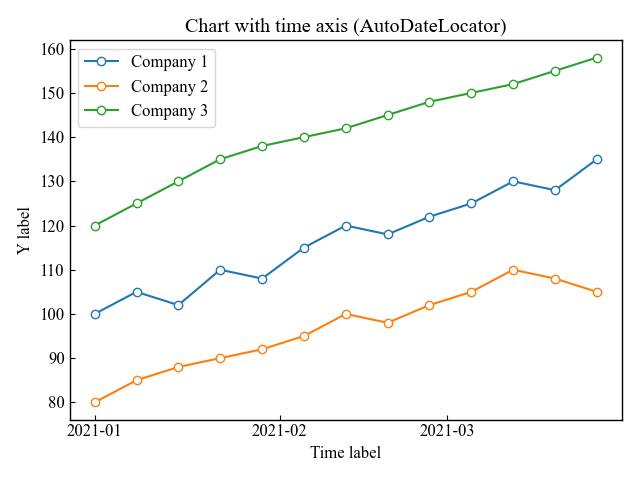
More frequent ticking of the scale (maxticks)
The manticks in the AutoDateLocator class can specify a maximum number of ticks
In this article, the maximum number of ticks is specified as 15
import matplotlib.dates as mdates

# step3 Plot time series graphs
ax.plot_date(date_list, company1_stock_prices, 'o-', label='Company 1')
ax.plot_date(date_list, company2_stock_prices, 'o-', label='Company 2')
ax.plot_date(date_list, company3_stock_prices, 'o-', label='Company 3')

#step4 Custom time axis
locator = mdates.AutoDateLocator(maxticks=15)
ax.xaxis.set_major_locator(locator)

plt.show()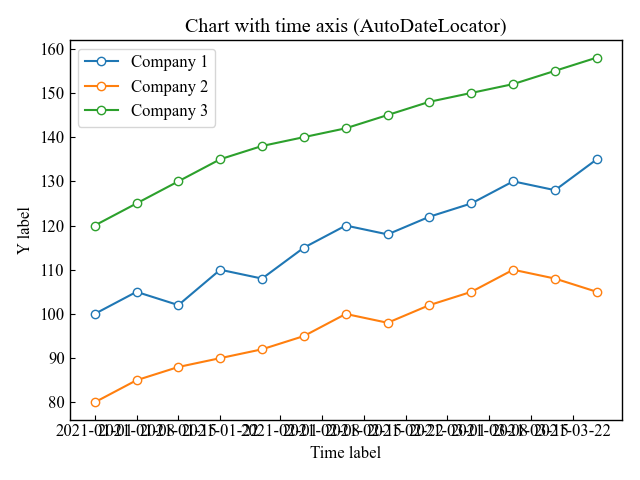
Compactly display the date (ConciseDateFormatter)
Dates tend to be long, and it is difficult to increase the number of scales when the x-axis is set as the time axis
The ConciseDateFormatter class can then be used to display the date in the best format and as compact as possible
- Parameters
-
- locater (ticker.Locator) : Locater created by AutoDateLocator
- tz (timezone string) : Ticks timezone
- formats (list of 6 strings) : Format strings for 6 levels of tick labelling: mostly years, months, days, hours, minutes, and seconds. Same format as strftime
['%Y', '%b', '%d', '%H:%M', '%H:%M', '%S.%f'] - zero_formats (list of 6 strings) :
['', '%Y', '%b', '%b-%d', '%H:%M', '%H:%M'] - offset_formats (list of 6 strings) :Format strings for the 6 levels that is applied to the “offset” string found on the right side of an x-axis, or top of a y-axis. Combined with the tick labels this should completely specify the date.
['', '%Y', '%Y-%b', '%Y-%b-%d', '%Y-%b-%d', '%Y-%b-%d %H:%M'] - show_offset (True or False) : Whether to show the offset or not.
- usetex (True or False) : TeX’s math mode for rendering
- Official Documentation
Automatically set date formatting (locater)
This section plots a graph by specifying the locater created in the previous section on More frequent ticking to the ConciseDateFormatter class
Year-month offset is displayed in the lower right corner, and the time axis is compactly organized.
#step4 Custom time axis
locator = mdates.AutoDateLocator(maxticks=15)
ax.xaxis.set_major_locator(locator)
formatter = mdates.ConciseDateFormatter(locator)
ax.xaxis.set_major_formatter(formatter)

plt.show()
Custom date formatting (formats, show_offset)
The formats can be specified in a list and are custom displayed in year, month, day, hour, minute, second format.
Default is ['%Y', '%b', '%d', '%H:%M', '%H:%M', '%S.%f'], changed'%b'→'%Y-%b', year + month
You can also hide the lower right offset with show_offset=False
#step4 Custom time axis
locator = mdates.AutoDateLocator(maxticks=15)
ax.xaxis.set_major_locator(locator)
# Change from '%b' to '%Y-%b'
formats=['%Y', '%Y-%b', '%d', '%H:%M', '%H:%M', '%S.%f']
formatter = mdates.ConciseDateFormatter(locator, formats=formats, show_offset=False)
ax.xaxis.set_major_formatter(formatter)

plt.show()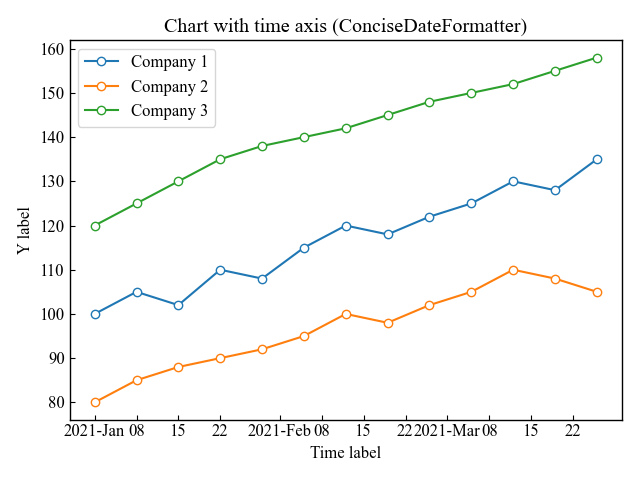
Display only some dates separately (offset_format, usetex)
offset_formats can be specified as a list to customize the display format of the offset in the lower right corner of the graph
Default is ['', '%Y', '%Y-%b', '%Y-%b-%d', '%Y-%b-%d', '%Y-%b-%d %H:%M'],with the third element changed'%Y-%b'→'%Y', year only.
Also, you can set use_tex to True for TeX formulas (I couldn’t tell the difference).
#step4 Custom time axis
locator = mdates.AutoDateLocator(maxticks=15)
ax.xaxis.set_major_locator(locator)
# Change from '%Y-%b' to '%Y'
offset_formats=['', '%Y', '%Y', '%Y-%b-%d', '%Y-%b-%d', '%Y-%b-%d %H:%M']
formatter = mdates.ConciseDateFormatter(locator, offset_formats=offset_formats, usetex=True)
ax.xaxis.set_major_formatter(formatter)

plt.show()
References
Official documentation for the Axes.plot_date function
Official documentation for the matplotlib.dates
Comments