
Experimental data are subject to basic errors, which are indicated by error bars on the graph.
Python can easily display a graph with error bars with little code!
This article describes in detail how to display error bars on line charts and scatter plots in Matplotlib.
From displaying graphical error bars on a line chart, to applying them to a scatter plot, to detailed Axes.errorbar function arguments.
Error bars on a line chart (Axes.errorbar)
In Matplotlib, the Axes.errorbar function displays an error bar.
- Parameters
-
- x, y (float or array) : The data positions.
- xerr, yerr (float or array) : The errorbar sizes
- fmt (str) : The format for the data points / data lines.
- ecolor (color) : The color of the errorbar lines.
- elinewidth (float) : The linewidth of the errorbar lines.
- capsize (float) : The length of the error bar caps in points.
- capthick (float) : The thickness of the error bar cap.
- barsabove (bool) : If True, will plot the errorbars above the plot symbols. Default is below.
- lolims, uplims, xlolims, xuplims (bool) : Error bars are indicated by arrows
- errorevery (int) : draws error bars on a subset of the data.
- Returns
- Official Documentation
-
matplotlib.axes.Axes.errorbar — Matplotlib 3.6.0 documentation
Error bars in array (yerr)
The simplest line chart with error bars.
The error bar data is defined in an array.
The following tabs explain the code and flowchart
import matplotlib.pyplot as plt
import numpy as np

# step1 Create data
x = np.arange(5)
y = [4.6, 3.6, 5, 4.2, 2.7]
yerr = [0.6, 0.9, 1.2, 0.5, 0.7]

# step2 Create graph frames
fig, ax = plt.subplots()

# step3 line chart with error bars
ax.errorbar(x, y, yerr)

ax.set_xlabel('X label')
ax.set_ylabel('Y label')
ax.set_title('Simple errorbar')

plt.show()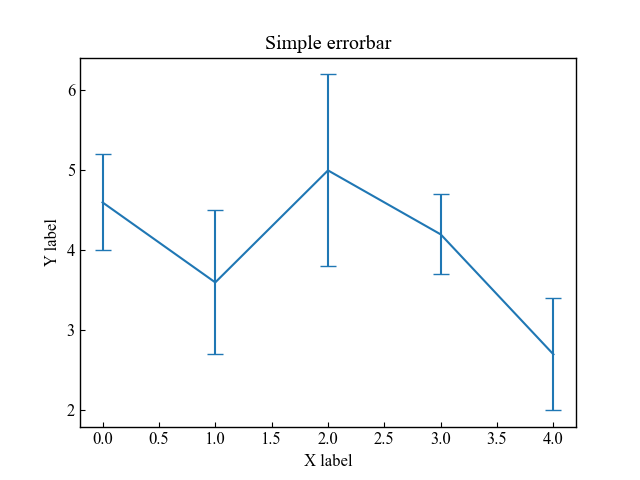
Error bars in scalar (xrr, yerr)
The simplest line chart with error bars.
The error bar data is defined by a single number only.
# step3 line chart with error bars
ax.errorbar(x, y, xerr=0.2, yerr=0.4)
Error bars on scatter plots and their format (fmt)
fmt (format string) can specify marker, linetype, and color at once as follows
fmt = '[marker][line][color]'It is also possible to make a scatter plot without lines and with markers only
Three types of graphs were created using fmt
# step3 line chart with error bars
# Circle + green + scatter plot
ax.errorbar(x, y, yerr=0.4, fmt='og' ,label='fmt="og"')
# Rectangle + red + single dotted line
ax.errorbar(x, [i+2 for i in y], yerr=0.4, fmt='sr-.' ,label='fmt="sr-."')
# Star + cyan + dotted line
ax.errorbar(x,  [i+4 for i in y], yerr=0.4, fmt='*c:' ,label='fmt="*c:"')
Color and thickness of error bars
This section describes how to define the color and thickness of error bars
Color of error bars (ecolor)
The color of the error bar is set using the ecolor argument to the Axes.errorbar function
In the following, I used ecolor=’red’ to make it red
# step3 line chart with error bars
ax.errorbar(x, y, yerr=0.4, fmt='o-', ecolor='red')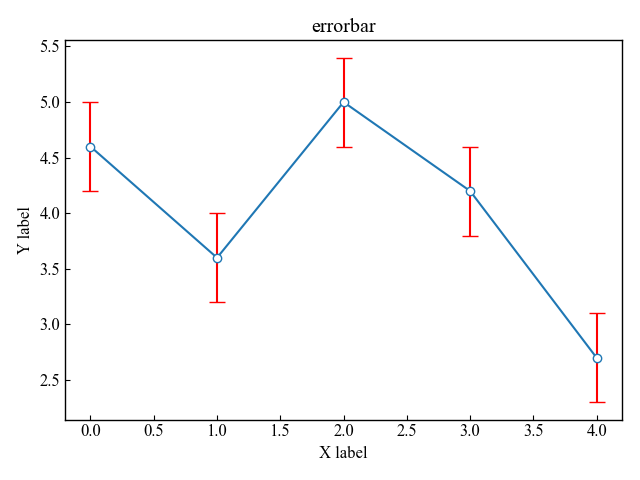
Thickness of error bars (elinewidth)
The thickness of the error bar is determined by the linelinewidth argument to the Axes.errorbar function
In the following I used linewidth=’0.5
# step3 line chart with error bars
ax.errorbar(x, y, yerr=0.4, fmt='o-', elinewidth=0.5)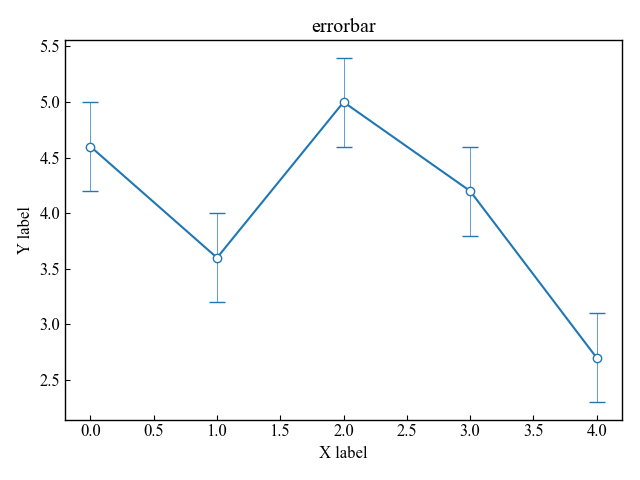
Error bar caps
This section describes how to define the length and thickness of the cap that represents the width of the error bar.
Also, here is an explanation of how to turn the cap into an arrow
Length of cap (capsize)
The length of the caps on the error bar is determined by the capsize argument of the Axes.errorbar function
In the following, capsize=0 to eliminate the cap portion
# step3 line chart with error bars
ax.errorbar(x, y, yerr=0.4, fmt='o-', ecolor='red', capsize=0)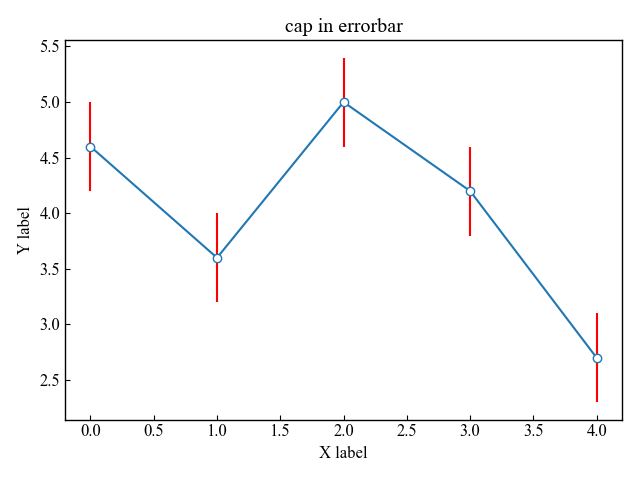
Thickness of cap (capthick)
The thickness of the error bar cap is determined by the capthick argument of the Axes.errorbar function
In the following, capthick=5 is used to make the cap thicker
# step3 line chart with error bars
ax.errorbar(x, y, yerr=0.4, fmt='o-', ecolor='red', capthick=5)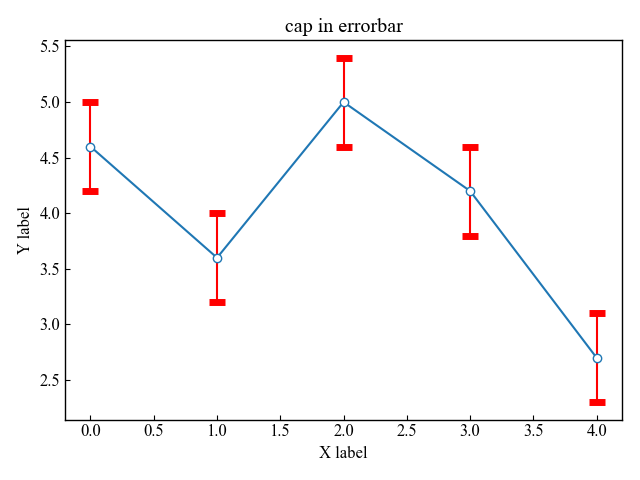
Change y-direction caps to arrows (uplims, lolims)
The uplims or lolims argument to the Axes.errorbar function can be used to change the caps on the error bar to arrows
In the following, uplims is the positive side in the y direction and lolims is the negative side in the y direction
# step3 line chart with error bars
ax.errorbar(x, y, yerr=0.4, fmt='o-', uplims=True, label='uplims')
ax.errorbar(x, [i+2 for i in y], yerr=0.4, fmt='o-', lolims=True, label='lolims')
Change x-direction caps to arrows (xuplims, xlolims)
The xuplims or xlolims argument to the Axes.errorbar function can be used to change the caps on the error bar to arrows
In the following, xuplims is the positive side in the x direction and xlolims is the negative side in the x direction
# step3 line chart with error bars
ax.errorbar(x, y, xerr=0.2, fmt='o-', xuplims=True, label='xuplims')
ax.errorbar(x, [i+2 for i in y], xerr=0.2, fmt='o-', xlolims=True, label='xlolims')
Error bar display style
This section describes the arguments related to the display of error bars
Define the z-position of the error bar, frequency of display, and arrow display.
z-position of error bar (barsabove)
The z-position of error bars and markers can be changed with barsabove
The argument barsabove=True in the Axes.errorbar function makes the error bar appear before the marker
# step3 line chart with error bars
ax.errorbar(x, y, yerr=0.4, fmt='o-', ecolor='gray', barsabove=True)
Frequency of error bar display (errorevery)
The frequency of displaying the error bar is determined by the argument of the Axes.errorbar function: errorrevery
In the following, error bars are displayed every 2 data with errorrevery=2
# step3 line chart with error bars
ax.errorbar(x, y, yerr=0.4, fmt='o-', ecolor='red', errorevery=2)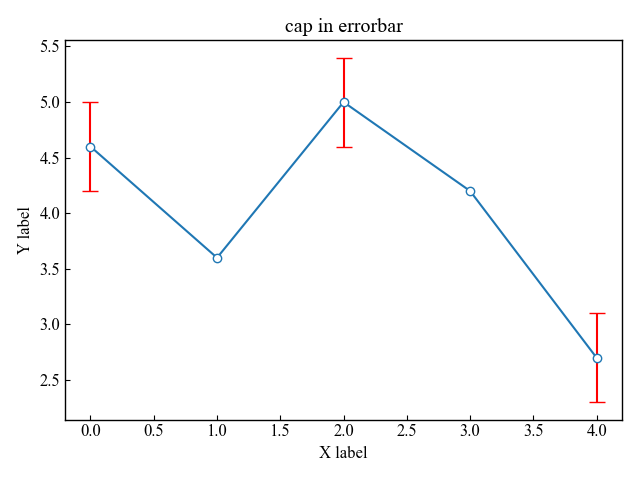
References
Axes.errorbar function
How to write the error bar
Comments