
Confused about creating histograms? It is important to create an accurate histogram to understand the distribution and patterns of data.
A histogram is a type of statistical chart with frequencies on the vertical axis and classes on the horizontal axis, and is also called a columnar chart or frequency distribution chart.
This article explains how to easily create accurate histograms using Matplotlib’s hist, hist2d, and PercentFormatter functions.
After reading this article, you will be able to create histograms for your own data. You will be able to identify trends in the frequency and density of your data and discover important characteristics.
General Histogram (Axes.hist)
The histogram is a 1D array as the first argument to the Axes.hist function
- Parameters
-
- x (array) : Input values, this takes either a single array or a sequence of arrays which are not required to be of the same length.
- bins (int or array) : If bins is an integer, it defines the number of equal-width bins in the range. If bins is a sequence, it defines the bin edges, including the left edge of the first bin and the right edge of the last bin; in this case, bins may be unequally spaced.
- range (array) : The lower and upper range of the bins.
- density (True or False) : If True, draw and return a probability density
- bottom (scalar or array) : Location of the bottom of each bin
- histtype (str) : The type of histogram to draw. (‘bar‘, ‘barstacked‘, ‘step’, ‘stepfilled’)
- align (str) : The horizontal alignment of the histogram bars. (‘left’, ‘mid’, ‘right’)
- orientation (str) : Changes the histogram direction to vertical or horizontal (‘vertical’, ‘horizontal’)
- stacked (True or False) : If True, multiple data are stacked on top of each other
- Returns
-
- n (array) : The values of the histogram bins.
- bins (array) : The edges of the bins. Length nbins + 1
- patches (BarContainer or list of Polygon) : Container of individual artists used to create the histogram or list of such containers if there are multiple input datasets.
- Official Documentation
The following tabs explain the code and flowchart
# step1 Create a reproducible random number generator
rng = np.random.default_rng(19680801)

# step2 Create data
N_points = 100000
n_bins = 20
dist1 = rng.standard_normal(N_points)

# step3 Create graoh frames
fig, ax = plt.subplots()

# step4 Plot a histogram
ax.hist(dist1, bins=n_bins)
ax.set_xlabel('X label')
ax.set_ylabel('Y label')
ax.set_title(r'A Simple Histogram')

plt.show()
Color-coded histograms by frequency
Histograms can be color-coded according to their frequencies to make them easier to understand
The following tabs explain the code and flowchart
# step4 Plot a histogram
# N is the number of bins in each bin, bins is the lower limit of bins
N, bins, patches = ax.hist(dist1, bins=n_bins)
# step5 Prepare for color setting
# Color-coded by height
fracs = N / N.max()
# Normalizes data from 0 to 1 over the entire range of the color map
norm = colors.Normalize(fracs.min(), fracs.max())
# step6 Set color for each object
# Loop through objects and set their respective colors
for thisfrac, thispatch in zip(fracs, patches):
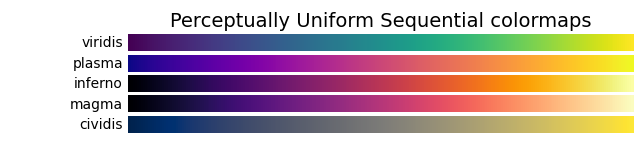
color = plt.cm.viridis(norm(thisfrac))
thispatch.set_facecolor(color)
plt.show()

Two-dimensional histogram (Axes.hist2d)
The function Axes.hist2d can plot a two-dimensional histogram of two datasets
Axes.hist2d specifies two arrays
- Parameters
-
- x (array) : Input values
- bins (int or array) : If it is an int, define the number of bins of the same width within the range. If it is an array, it defines the number of bins to include the leftmost and rightmost bins.
- range (array) : The leftmost and rightmost edges of the bins along each dimension
- density (True or False) : Normalize histogram
- Returns
-
- h (2D array) : The bi-dimensional histogram of samples x and y. Values in x are histogrammed along the first dimension and values in y are histogrammed along the second dimension.
- xedges (1D array) : The bin edges along the x-axis.
- yedges (1D array) : The bin edges along the y-axis.
- image (QuadMesh) : Class for efficiently drawing quadrilateral meshes
- Official Documentation
# Generate a second set of normally distributed data
dist2 = 0.4 * rng.standard_normal(N_points) + 5

# step4 Plot a two-dimensional histogram
ax.hist2d(dist1, dist2)

plt.show()
Histogram with vertical axis as percent (density)
This section explains how to change the vertical axis from degrees to percentages
If density is set to True in the Axes.hist function, it becomes a probability density with a maximum value of 1
Replacing the y-axis with a percentage display in matplotlib.ticker.PercentFormatter
- Parameters
-
- xmax (float) : Percentages are computed as x / xmax * 100
- decimals (int) : The number of decimal places to place after the point.
- symbol (str) : A string that will be appended to the label.
- is_latex (True or False) : If False, reserved LaTeX characters in symbol will be escaped.
- Official Documentation
# step4 Plot a Histogram
# Setting density=True results in a probability density
ax.hist(dist1, bins=n_bins, density=True)

# Y-axis formatted for percentage display
ax.yaxis.set_major_formatter(PercentFormatter(xmax=1))

plt.show()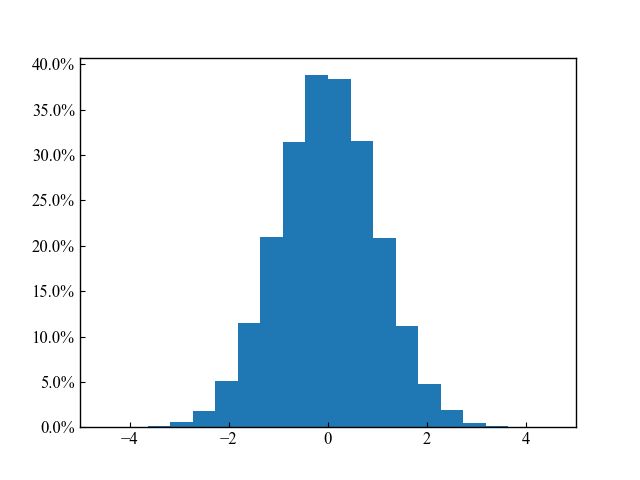
Staircase histogram (histtype=step)
You can create a staircase histogram with the Axes.hist argument histtype=’step
If the data is a 1D array, the histtype is the same for bar, barstacked, and stepfilled
# step4 Plot a Histogram
ax.hist(dist1, bins=n_bins, histtype='step')

plt.show()
Histograms with multiple data sets
It is also possible to plot a histogram when multiple data sets (2-dimensional array) are specified
Graphs can be represented in two ways: stacked or side-by-side
The following was used for the 2D array data
# 2-dimensional array of 100000 rows and 3 columns
dist1 = rng.standard_normal(size=(N_points, 3))
Arrange data sets side by side. (histtype=bar)
If bar is specified for histtype (default), the dataset is lined up horizontally
# step4 Plot a Histogram
ax.hist(dist1, bins=n_bins)

plt.show()
Fill and stack data (histtype=barstacked)
If barstacked is specified for histtype, the dataset will be stacked
# step4 Plot a Histogram
ax.hist(dist1, bins=n_bins, histtype='barstacked')

plt.show()
Stack Data Sets without Fill (stacked)
If histtype is set to step and stacked=True, the dataset will be stacked without being filled
# step4 Plot a Histogram
ax.hist(dist1, bins=n_bins, histtype='step', stacked=True)

plt.show()
References
Histogram Basics
Setting Histogram Type (histtype)
Histogram with multiple data
Comments