
Sometimes it is easier to understand multiple graphs if they are displayed together.
This article explains how to display multiple graphs in a single window using Matplotlib.
Two methods are introduced: the matrix method and the GridSpec method to arrange them as you wish.
Arrange multiple graphs in a matrix method.
Multiple graphs can be placed in a single window using the matrix method
The order of rows and columns is specified in parentheses, as in plt.subplots(rows, columns)
- Parameters
-
- nrows, ncols (int) : Number of rows/columns of the subplot grid.。
- sharex, sharey (‘none’, ‘all’, ‘row’, ‘col’) : Controls sharing of properties among x (sharex) or y (sharey) axes
- squeeze (True or False) : If True, extra dimensions are squeezed out from the returned array of Axes
- Returns
- Official Documentation
1 row, 2 columns
The pyplot.subplots function creates a graph with 1 row and 2 columns.
fig, axs = plt.subplots(1, 2)
axs[0].plot(x, y1) :0th Axes.axs[1].plot(x, y1, color='red') : 1st Axes.
# step0 Import libraries
import matplotlib.pyplot as plt
import numpy as np

# step1 Create data
x = np.linspace(0, 10, 100)
y1 = 4 + 2 * np.sin(2 * x)
y2 = 4 + 2 * np.cos(2 * x)

# step2 Create graph frames
fig, axs = plt.subplots(1, 2, figsize=(8, 4), layout='constrained')

# step3 Plot graphs
axs[0].plot(x, y1)
axs[0].plot(x, y2)
axs[1].plot(x, y1, color='red')
axs[1].plot(x, y2, color='gray')

# step4 Set titles and axis labels
axs[0].set_xlabel('X1 label')
axs[0].set_ylabel('Y1 label')
axs[0].set_title('Title 1')
axs[1].set_xlabel('X2 label')
axs[1].set_ylabel('Y2 label')
axs[1].set_title('Title 2')

# step5 Call the Figure
plt.show()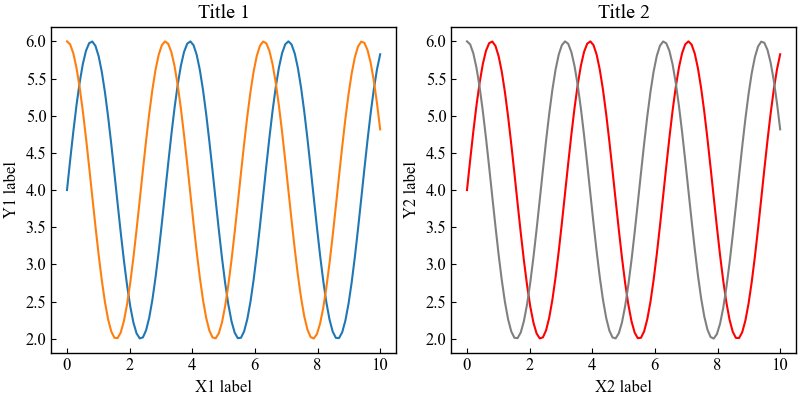
2 rows, 1 column
The pyplot.subplots function creates a graph with 2 rows and 1 column.
fig, axs = plt.subplots(2, 1)
axs[0].plot(x, y1) : 0th Axesaxs[1].plot(x, y1, color='red') : 1st Axes
# step2 Create graph frames
fig, axs = plt.subplots(2, 1, figsize=(6, 6), layout='constrained')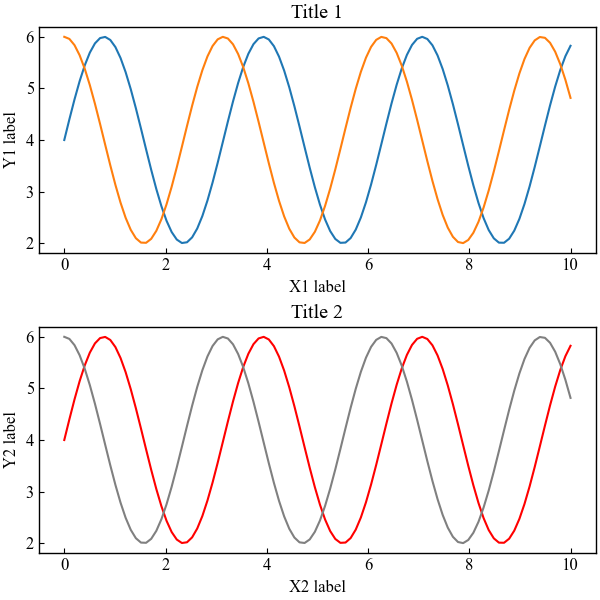
2 rows, 2 columns
The pyplot.subplots function creates a graph with 2 rows and 2 columns.
fig, axs = plt.subplots(2, 2)
axs[0, 0].plot(x, y1) : 0 rows, 0 columns Axes。axs[0, 1].plot(x, y2, color='green') : 0 rows, 1 columns Axes。
# step2 Create graph frames
fig, axs = plt.subplots(2, 2, figsize=(8, 6), layout='constrained')

# step3 Plot graphs
axs[0, 0].plot(x, y1)
axs[0, 1].plot(x, y2, color='green')
axs[1, 0].plot(x, y1, color='red')
axs[1, 1].plot(x, y2, color='gray')

# step4 Set titles and axis labels
axs[0, 0].set_xlabel('X1 label')
axs[0, 0].set_ylabel('Y1 label')
axs[0, 0].set_title('Title 1')
axs[0, 1].set_xlabel('X2 label')
axs[0, 1].set_ylabel('Y2 label')
axs[0, 1].set_title('Title 2')
axs[1, 0].set_xlabel('X3 label')
axs[1, 0].set_ylabel('Y3 label')
axs[1, 0].set_title('Title 3')
axs[1, 1].set_xlabel('X4 label')
axs[1, 1].set_ylabel('Y4 label')
axs[1, 1].set_title('Title 4')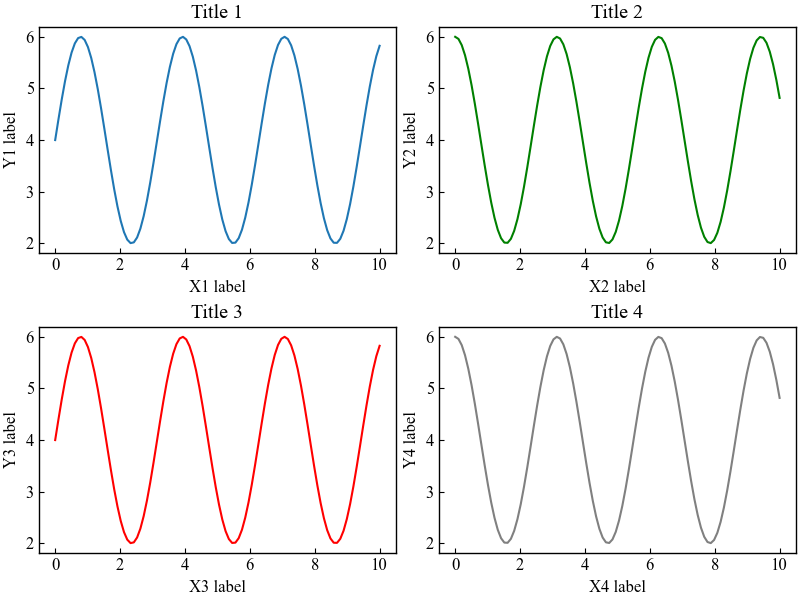
Reduce code with for (ndarray.flat)
As the number of graphs increases, such as 2 rows, 2 columns, the number of codes also increases.
The numpy.ndarray.flat function is used to turn an array of Axes into a one-dimensional array and reduce the code with “for”.axs.flat
for i, ax in enumerate(axs.flat):
    # step3 Plot graphs
    ax.plot(x, y1, color='C'+str(2*i))
    ax.plot(x, y2, color='C'+str(2*i+1))

    # step4 Set titles and axis labels
    ax.set_xlabel('X'+str(i+1)+' label')
    ax.set_ylabel('Y'+str(i+1)+' label')
    ax.set_title('Title '+str(i+1))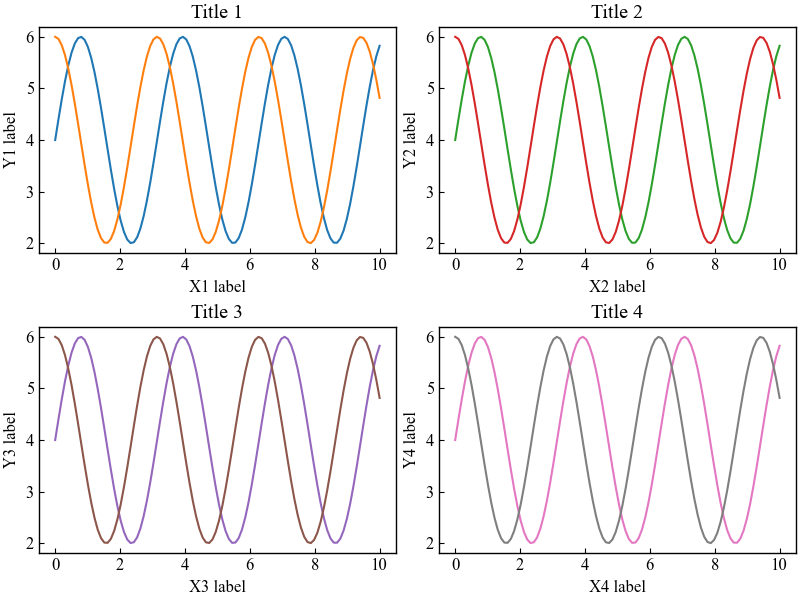
Transposing a matrix results in a column-by-column orderingaxs.T.flat
for i, ax in enumerate(axs.T.flat):
    # step3 Plot graphs
    ax.plot(x, y1, color='C'+str(2*i))
    ax.plot(x, y2, color='C'+str(2*i+1))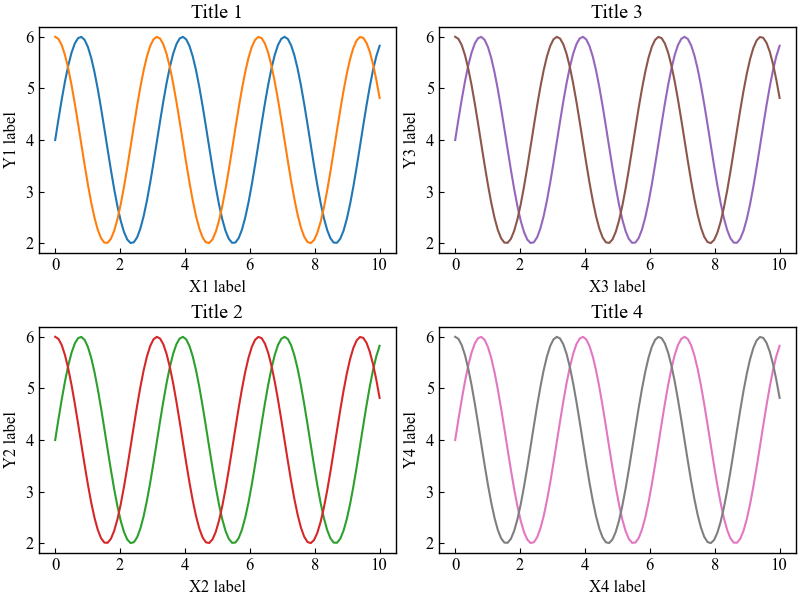
Arrange graphs freely with GridSpec
GridSpec allows you to create a grid layout and arrange graphs as you wish.
- Paramters
-
- nrows, ncols (int) : The number of rows and columns of the grid.
- figure (Figure) : Only used for constrained layout to create a proper layoutgrid.
- left, right, top, bottom (float) : Extent of the subplots as a fraction of figure width or height.
- wspace, hspace (float) : Space between subplots, expressed as a fraction of the average.
- Official Documentation
import at the beginning of the code
import matplotlib.gridspec as gridspecGridSpec for free placement in a 3×3 fig.
Place 5 graphs in a 3×3 fig grid layout
Enter the matrix (3×3) and Figure (fig) of the grid as arguments to gridspec.gs = gridspec.GridSpec(3, 3, figure=fig)
Specify the grid you want to place as the argument of add_subplotax1 = fig.add_subplot(gs[0, :]): Row 1, columns are allax2 = fig.add_subplot(gs[1, :-1]): Row 2, to the last columnax3 = fig.add_subplot(gs[1:, -1]): Row 2 and after, last column
# step0 Import libraries
import matplotlib.pyplot as plt
import numpy as np
import matplotlib.gridspec as gridspec

# step1 Create data
x = np.linspace(0, 10, 100)
y1 = 4 + 2 * np.sin(2 * x)
y2 = 4 + 2 * np.cos(2 * x)

# step2 Create graph frames
fig = plt.figure(constrained_layout=True)
# 3 rows and 3 columns grid layout
gs = gridspec.GridSpec(3, 3, figure=fig)

# step3 Plot graphs
ax1 = fig.add_subplot(gs[0, :])
ax1.plot(x, y1, color='C0')

ax2 = fig.add_subplot(gs[1, :-1])
ax2.plot(x, y1, color='C1')

ax3 = fig.add_subplot(gs[1:, -1])
ax3.plot(x, y1, color='C2')

ax4 = fig.add_subplot(gs[2, 0])
ax4.plot(x, y1, color='C3')

ax5 = fig.add_subplot(gs[2, 1])
ax5.plot(x, y1, color='C4')

# step4 Set a title
fig.suptitle('GridSpec 3×3')

# step5 Call the Figure
plt.show()
GridSpecFromSubplotSpec to place graphs by column
GridSpecFromSubplotSpec inherits grid layouts created with GridSpec
Inheriting only the column component of GridSpec allows per-column graph placement
Create a 1 row, 2 columns grid layout with GridSpec.gs0 = gridspec.GridSpec(1, 2, figure=fig)
The first column inherits from GridSpecFromSubplotSpec to create a 3 rows, 1 column grid layout.gs1 = gridspec.GridSpecFromSubplotSpec(3, 1, subplot_spec=gs0[0])
The second column inherits from GridSpecFromSubplotSpec to create a 2 rows, 1 column grid layout.gs2 = gridspec.GridSpecFromSubplotSpec(2, 1, subplot_spec=gs0[1])
# step2 Create graph frames
fig = plt.figure(constrained_layout=True)
# 1 row, 2 columns grid layout
gs0 = gridspec.GridSpec(1, 2, figure=fig)

# step3 Plot graphs
# The first column inherits from GridSpecFromSubplotSpec to create a 3 rows, 1 column grid layout.
gs1 = gridspec.GridSpecFromSubplotSpec(3, 1, subplot_spec=gs0[0])
for n in range(3):
    ax = fig.add_subplot(gs1[n])
    ax.plot(x, y1, color='C'+str(n), label='ax'+str(n+1))

# The second column inherits from GridSpecFromSubplotSpec to create a 2 rows, 1 column grid layout.
gs2 = gridspec.GridSpecFromSubplotSpec(2, 1, subplot_spec=gs0[1])
for n in range(2):
    ax = fig.add_subplot(gs2[n])
    ax.scatter(x, y1, color='C'+str(n+3), label='ax'+str(n+4))
References
Resizing axes with constrained layout
GridSpec
Using GridSpec
GridSpecFromSubplotSpec
Comments