Are you struggling with how to display straight lines and band lines on a graph?
If you want to highlight specific data points or ranges, it is important to plot straight lines and stripes in the right way!
Python’s Matplotlib makes it easy to plot horizontal and vertical lines with just a few lines of code!
This article details how to use Matplotlib’s hlines, vlines, axhline, axvline, axline, axhspan, axvspan, and other functions to easily plot straight and striped lines on a graph.
Infinitely long straight line (axhline, axvline, axline)
This section describes how to plot a line that is infinitely long and spans an axis
axhline and axvline can display horizontal and vertical lines, and axline can display lines with coordinates.
Horizontal line (axhilne)
A horizontal line is displayed by specifying a value of the y-coordinate in the axhline function
Draw a straight line at y = 0.75
- Parameters
-
- y (float) : y position in data coordinates of the horizontal line.
- xmin (float) : Should be between 0 and 1, 0 being the far left of the plot, 1 the far right of the plot.
- xmax (float) : hould be between 0 and 1, 0 being the far left of the plot, 1 the far right of the plot.
- Returns
- Official Documentation
The following tabs explain the code and flowchart
import matplotlib.pyplot as plt
import numpy as np

# step1 Create graph frames
fig, ax = plt.subplots()
# step2 Plot straight lines with Axes.axhline
threshold = 0.75
ax.axhline(threshold, color='C0', lw=2)

ax.set_title('Axhline')
ax.set_xlim(0, 1)
ax.set_ylim(0, 1)
ax.set_xlabel('Xlabel')
ax.set_ylabel('Ylabel')

plt.show()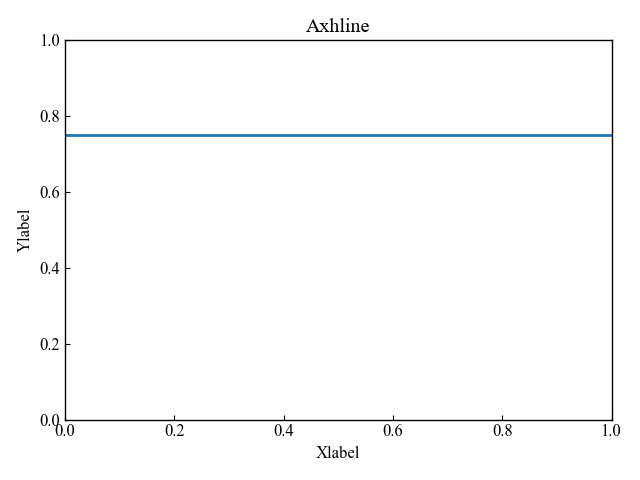
Vertical line (axvline)
A vertical line is displayed by specifying a value of the y-coordinate in the axvline function
Draw a straight line at y = 0.75
- Parameters
-
- x (float) : x position in data coordinates of the vertical line.
- ymin (float) : Should be between 0 and 1, 0 being the bottom of the plot, 1 the top of the plot.
- ymax (float) : Should be between 0 and 1, 0 being the bottom of the plot, 1 the top of the plot.
- Returns
- Official Documentation
# step2 Plot straight lines with Axes.axvline
threshold = 0.75
ax.axvline(threshold, color='C1', lw=2)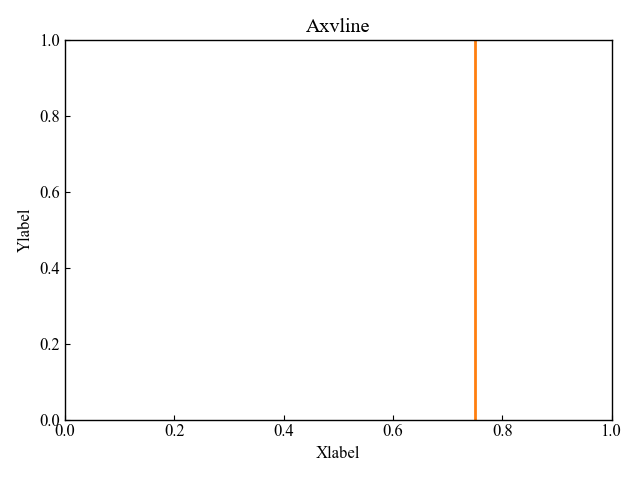
Straight line with specified coordinates and slope (axline)
The axline function can be used to plot an arbitrary line by specifying two coordinates or a single coordinate and a slope.
- Parameters
-
- xy1 (float) : Points for the line to pass through.
- xy2 (float) : Either xy2 or slope has to be given.
- slope (float) : The slope of the line. Either xy2 or slope has to be given.
- Returns
- Official Documentation
Draws a line passing through the coordinates (0, 0) and (4, 8)
# step2 Plot a straight line with Axes.axline
ax.axline((0, 0), (4, 8), color='red', lw=2)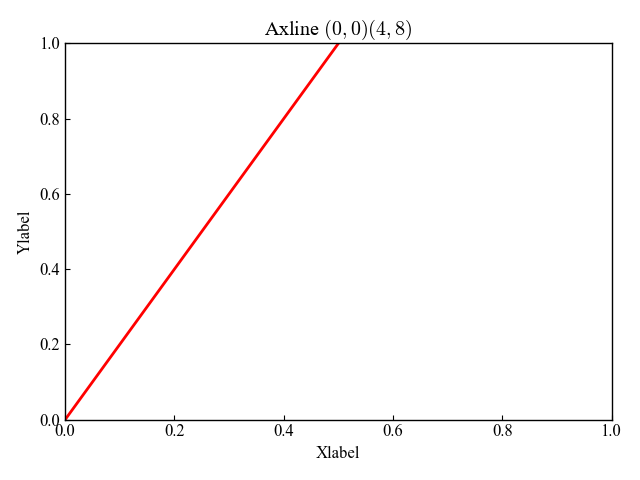
Draws a line with coordinates (0, 0) and slope 0.5
# step2 Plot a straight line with Axes.axline
ax.axline((0, 0), slope=0.5, color='#0097a7', lw=2)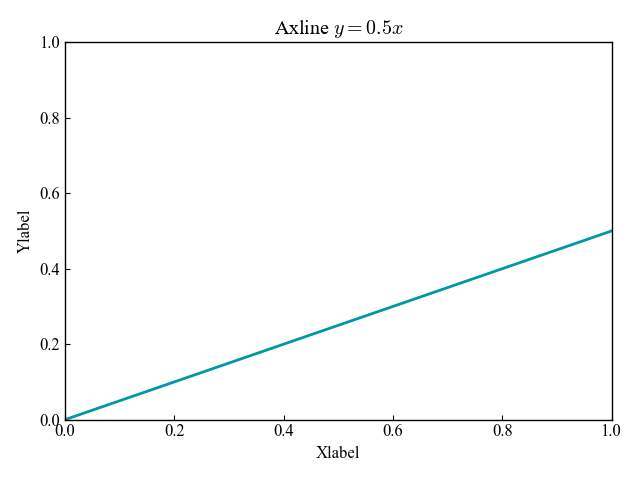
Horizontal straight line (Axes.hlines)
The function Axes.hlines plots a horizontal line
A straight line of any length can be displayed by specifying a range of x
- Parameters
-
- y (float or array-like) : y-indexes where to plot the lines.
- xmin, xmax (float or array-like) : Respective beginning and end of each line.
- colors (list of colors) : Line color
- linestyles : Line Style(dashed, –)
- label (str) : Labels.
- Returns
- Official Documentation
The following tabs explain the code and flowchart
import matplotlib.pyplot as plt
import numpy as np

# step1 Create data
t = np.arange(0.0, 5.0, 0.1)
s = np.exp(-t) + np.sin(2 * np.pi * t) + 1
# step2 Create graph frames
fig, ax = plt.subplots()

ax.plot(s, t, '^')
# step3 Plot horizontal lines with Axes.hlines
ax.hlines(t, 0, s, lw=2)

ax.set_xlabel('time (s)')
ax.set_title('Horizontal lines demo')

plt.show()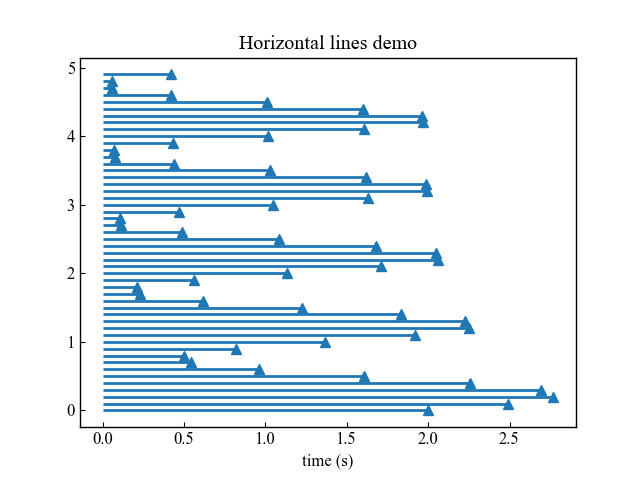
Vertical straight line (Axes.vlines)
The function Axes.vlines plots a vertical line
A straight line of any length can be displayed by specifying a range of y
- Parameters
-
- x (float or array-like) : x-indexes where to plot the lines.
- ymin, ymax (float or array-like) : Respective beginning and end of each line.
- colors (list of colors) : Line color
- linestyles : Line Style(dashed, –)
- label (str) : Labels.
- Returns
- Official Documentation
ax.plot(t, s, '^')
ax.vlines(t, 0, s, lw=2)

plt.show()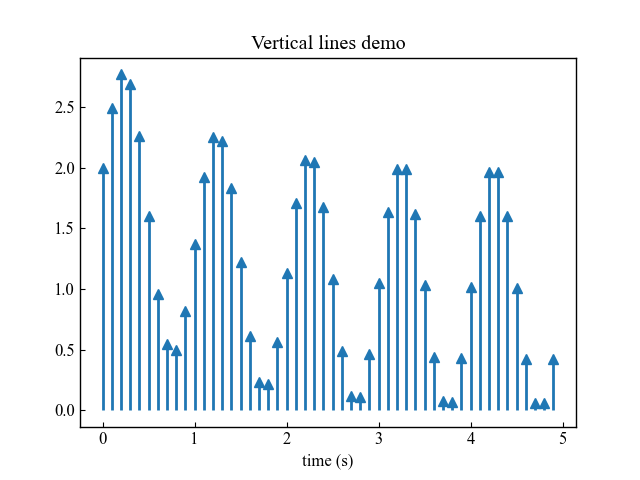
Infinitely long span (axhspan, axvspan)
It is also possible to display a span with any desired width instead of a line
axhspan can plot horizontal spans, axvspan vertical spans
Horizontal span (axhspan)
A horizontal span is displayed by specifying the maximum and minimum values of y in the axhspan function
Drawn with ymin = 5, ymax = 8
- Prameters
-
- ymin (float) : Lower y-coordinate of the span, in data units.
- ymax (float) : Upper y-coordinate of the span, in data units.
- xmin (float) : Lower x-coordinate of the span, in x-axis (0-1) units.
- xmax (float) : Upper x-coordinate of the span, in x-axis (0-1) units.
- Returns
-
- Polygon : Horizontal span (rectangle) from (xmin, ymin) to (xmax, ymax).
- Official Documentation
import matplotlib.pyplot as plt
import numpy as np

# step1 Create data
min_value = 5
max_value = 8
# step2 Create graph frames
fig, ax = plt.subplots()
# step3 Plot a horizontal span with Axes.hspan
ax.axhspan(min_value, max_value, color='C0', alpha=0.7)
ax.set_title('Axhspan')

ax.set_xlim(0, 10)
ax.set_ylim(0, 10)
ax.set_xlabel('Xlabel')
ax.set_ylabel('Ylabel')

plt.show()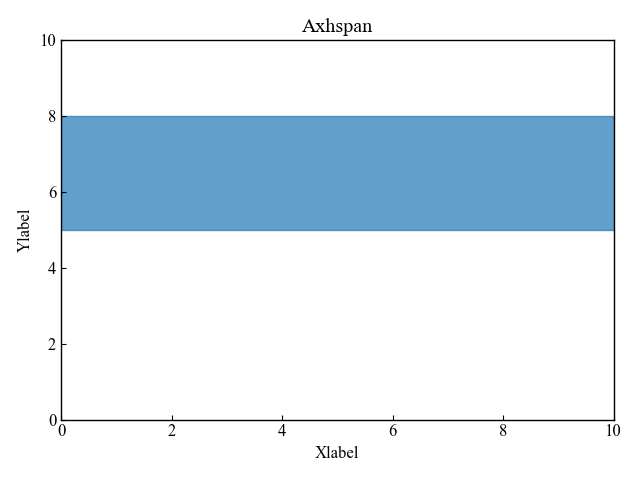
Vertical span (axvspan)
A horizontal span is ploted by specifying the maximum and minimum values of x in the axvspan function
Drawn with xmin = 5, xmax = 8
- Parameters
-
- xmin (float) : Lower x-coordinate of the span, in data units.
- xmax (float) : Upper x-coordinate of the span, in data units.
- ymin (float) : Lower y-coordinate of the span, in y-axis units (0-1).
- ymax (float) : Upper y-coordinate of the span, in y-axis units (0-1).
- Returns
- Official Documentation
# step3 Plot a vertical span ith Axes.vspan
ax.axvspan(min_value, max_value, color='C1', alpha=0.7)
ax.set_title('Axvspan')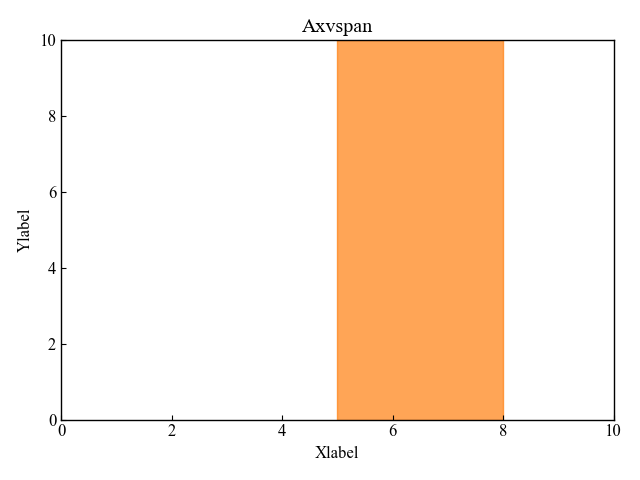
References
Official documentation for hlines and vlines to display arbitrary straight lines
Official documentation for axhline, axvline, and axline to display infinitely long lines
Official documentation for axhspan and axvspan to display infinitely long span
Comments