
Have you ever wanted to draw a graph to visualize data in Python?
Python has an excellent library for creating graphs called Matplotlib
This article describes how to use the most common Axes.plot function for line and scatter plots.
It also explains how to customize colors, line types, thickness, etc.

Line graphs (Axes.plot)
The most basic graphs in Matplotlib use the Axes.plot function
Entering only y in Axes.plot displays y values at equal intervals on the graph, but entering both x and y results in an x versus y graph.
- Patameters
-
- x, y (array-like or scalar) : The horizontal / vertical coordinates of the data points. x values are optional and default to
range(len(y)). - label (str) : Labels.
- fmt (str) : Format strings are just an abbreviation for quickly setting basic line properties.
- linestyle (str) : Line Style. [
-(solid),--(dashed),-.(dashdot),:(dotted), (None)] - linewidth (float) : line width
- alpha (float) : Transparency.0~1 range
- marker (str) : Marker Type.matplotlib.markers
- markerfacecolor (color) : Main color of the marker
- markeredgecolor (color) : Border color of the marker
- markeredgewidth (float) : Width of marker border
- fillstyle (str) : Fill area of the marker.
full, left, right, bottom, top, none
- x, y (array-like or scalar) : The horizontal / vertical coordinates of the data points. x values are optional and default to
- Returns
-
- list of Line2D
- Official Documentation
The following tabs explain the code and flowchart
# step0 Import libraries
import matplotlib.pyplot as plt
import numpy as np

# step1 Crete data
x = np.linspace(0, 10, 100)
y1 = 4 + 2 * np.sin(2 * x)
y2 = 4 + 2 * np.cos(2 * x)

# step2 Create data frames
fig, ax = plt.subplots()

# step3 Plot line graphs
ax.plot(x, y1, linestyle='-', label='Sample 1')
ax.plot(x, y2, linestyle='--', label='Sample 2')

# step4 Set the axis, legend, title
ax.set_xlim(0, 8)
ax.set_ylim(0, 8)
ax.set_xlabel('X label')
ax.set_ylabel('Y label')
ax.legend()
ax.set_title('Simple line')

# step5 Call the Figure
plt.show()
Scatter plot (fmt)
Scatter plots with the Axes.plot function do not specify line styles, only markers.
In this case, it is convenient to use fmt (format string) to specify marker, line color, and line type at once.
or--: o=circle, r=red, --=dashed
# step3 Plot scatter plots
ax.plot(x, y1, 'o',label='Sample 1')
ax.plot(x, y2, 'or--', label='Sample 2')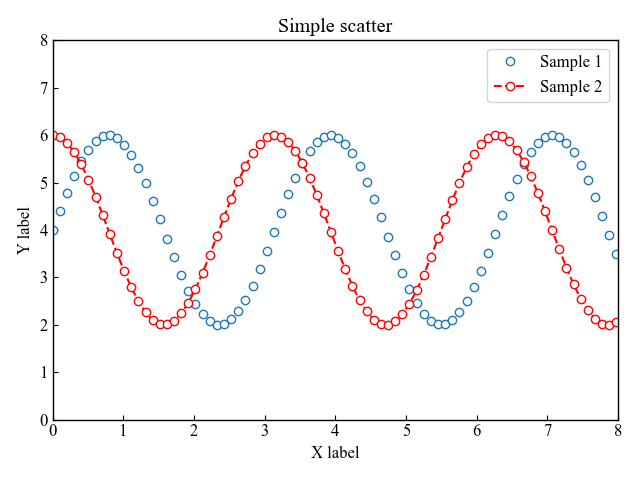
Line style and transparency for line graphs
Line customization, such as color, type, and thickness, is done using color, linestyle, and linewidth
alpha=0~1 changes the transparency.
Line color (color)
For line color, enter color as the argument.
color='red': red
color='00BCD4': color code
# step3 Plot line graphs
ax.plot(x, y1, label='red', color='red')
ax.plot(x, y2, label='#00BCD4', color='#00BCD4')
Line type (linestyle)
Use linestyle for the line type.
linestyle='-': solidlinestyle='--': dashedlinestyle='-.': dashdotlinestyle=':': dottedlinestyle='': None
# step3 Plot line graphs
ax.plot(x, y1, label='dashed', linestyle='-.')
ax.plot(x, y2, label='dotted', linestyle=':')
Line width and transparency (linewidth, alpha)
For line thickness, enter a numerical value in linewidth.
linewidth=5: Thickness 5
For line transparency, enter alpha=0.5 and a number between 0~1
# step3 Plot line graphs
ax.plot(x, y1, label='linewidth=5', linewidth=5)
ax.plot(x, y2, label='lw=5, alpha=0.5', linewidth=5, alpha=0.5)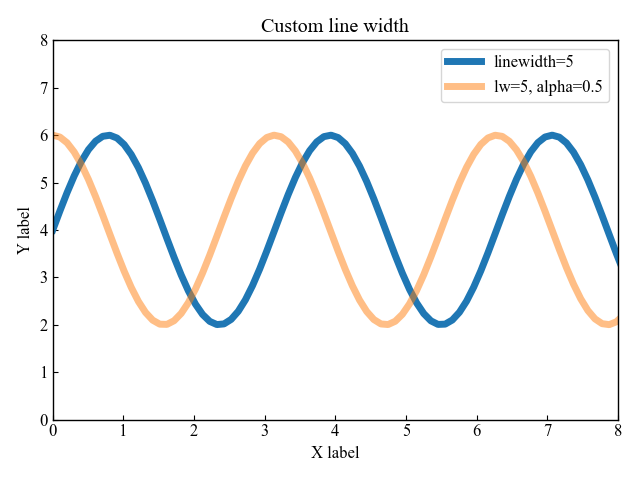
Markers for line graphs (marker)
The marker type can be selected by entering a string from matplotlib.markers
only markers with fmt: no line = scatter plot
marker with marker: with line = line chart
Specify markers with marker
Markers are circles, squares, and triangles
marker='o': circle, marker='s': square, marker='^': triangle
# step3 Plot line graphs
ax.plot(x, y1, marker='o', label='marker=o')
ax.plot(x, y2, marker='s', label='marker=s')
ax.plot(x, y2-2, marker='^', label='marker=^')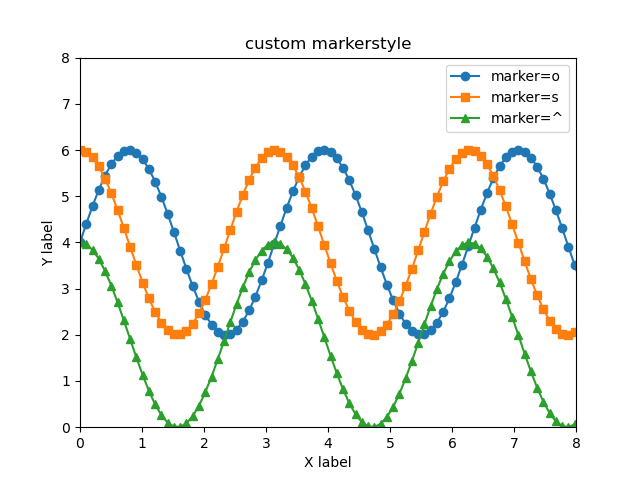
Specify only markers with fmt
fmt (format string) specifies marker, line color, and line type at once
Details are shown in the scatter plot
# step3 Plot sctter plots
ax.plot(x, y1, 'o', label='fmt=o')
ax.plot(x, y2, 's', label='fmt=s')
ax.plot(x, y2-2, '^', label='fmt=^')
Marker color for line graphs
Marker color can be divided into two types: surface and border.
The area to be filled can also be specified.
Main color of the marker (markerfacecolor)
Marker surface colors were set to white and black
markerfacecolor='white': White surface
# step3 Plot line graphs
ax.plot(x, y1, marker='o', label='face=white', markerfacecolor='white')
ax.plot(x, y2, marker='s', label='face=black', markerfacecolor='black')
Border color and width of the marker (markeredgecolor, markeredgewidth)
The color and thickness of the marker’s border can be changed.
markeredgecolor='red': Red bordermarkeredgewidth=3: Thickness 3 border
# step3 Plot line graphs
ax.plot(x, y1, marker='o', label='edgecolor=red',
        markeredgecolor='red')
ax.plot(x, y2, marker='s', label='edgewidth=3',
        markeredgecolor='red', markeredgewidth=3)
Fill area of the marker (fillstyle)
The fill area of the marker is determined by the fillstyle
The available areas are full, left, right, bottom, top, none.
# step3 Plot line graphs
ax.plot(x, y1, marker='o', label='fill=top', fillstyle='top')
ax.plot(x, y2, marker='s', label='fill=bottom', fillstyle='bottom')
Clean format for thesis
Combining the two marker types + surface color will produce a beautiful graph.
markerfacecolor='white': White surfacemarker='o': circle, marker='s': square, marker='^': triangle
# step1 Create data
x = np.linspace(0, 10, 100)
y1 = 4 + 2 * np.sin(2 * x)
y2 = 4 + 2 * np.cos(2 * x)

# step2 Create graph frames
fig, ax = plt.subplots()

# step3 Plot line graphs
ax.plot(x, y1, marker='o', label='marker=o', markerfacecolor='white')
ax.plot(x, y2, marker='s', label='marker=s', markerfacecolor='white')
ax.plot(x, y2-2, marker='^', label='marker=^', markerfacecolor='white')

# step4 Set the axis, legend, title
ax.set_xlim(0, 8)
ax.set_ylim(0, 8)
ax.set_xlabel('X label')
ax.set_ylabel('Y label')
ax.legend()
ax.set_title('Plot graph for a thesis')

# step5 Call the Figure
plt.show()References
Axes.plot Function
lines.Line2D class
Comments