
A step graph is a graph of vertical and parallel lines connecting data.
It is used to visualize data trends, patterns of change, and step functions. It is especially suited for visualizing categorical or cumulative data.
It is also useful for highlighting changes or events that occur over time.
This article explains how to plot a step graph in Python’s Matplotlib
Basic step graph
In Matplotlib, the step function draws a step graph with an array of x and y values.
- Parameters
- Returns
-
- list of Line2D
- Official Documentation
The following tabs explain the code and flowchart
import matplotlib.pyplot as plt
import numpy as np

# step1 Create data
x = np.arange(10)
y = np.sin(x)

# step2 Create graph frames
fig, ax = plt.subplots()

# step3 Plot a step graph
ax.step(x, y, label='Sample 1')
ax.step(x, y+2, label='Sample 2')

ax.set_xlabel('X label')
ax.set_ylabel('Y label')
ax.legend()
ax.set_title('Step Line Chart')

plt.show()
Set the format (fmt)
fmt (format string) can define marker, linetype, and color at once, as shown below.
fmt = '[marker][line][color]'I created three different staircase graphs using fmt
# step3 Plot a step graph
# Circle + green + dashed line
ax.step(x, y, 'og--' ,label='fmt="og--"')
# Rectangle + red + single dotted line
ax.step(x, y+2, 'sr-.' ,label='fmt="sr-."')
# Star + cyan + dotted line
ax.step(x, y+4, '*c:' ,label='fmt="*c:"')

plt.show()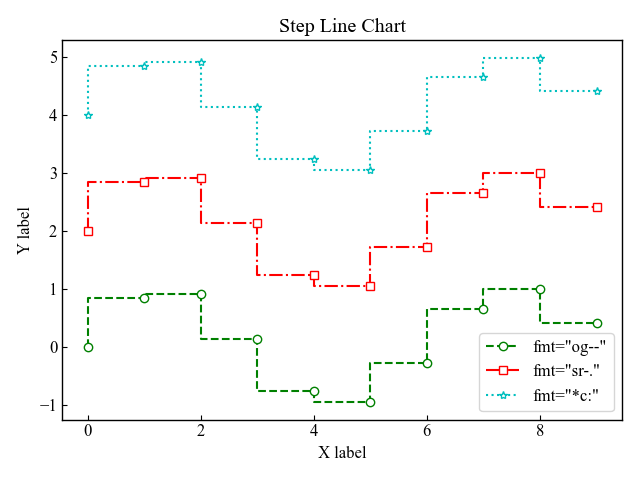
Change the marker
Markers can be specified from 25 different types
In the following I have drawn with three types of circles, squares and triangles.
# step3 Plot a step graph
# Markers
ax.step(x, y, 'o-' ,label='circle')
ax.step(x, y+2, 's-' ,label='square')
ax.step(x, y+4, '^-' ,label='triangle_up')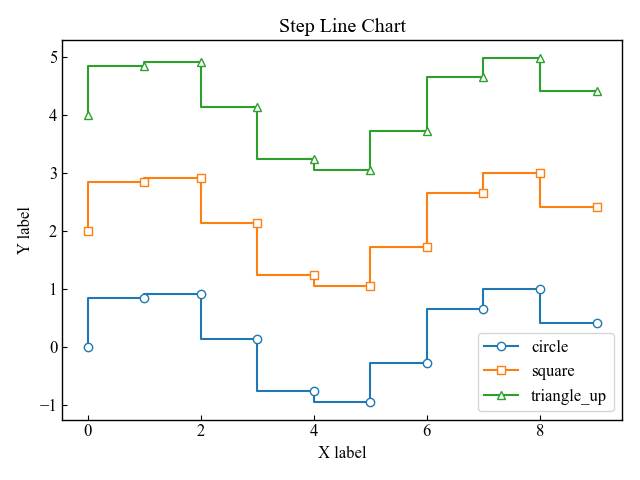
Change the line style
The line style can be defined from among four types: solid, dashed, dash, dotted, and dotted.
# step3 Plot a step graph
# Line styles
ax.step(x, y, '-' ,label='solid')
ax.step(x, y+2, '--' ,label='dashed')
ax.step(x, y+4, '-.' ,label='dash-dot')
ax.step(x, y+6, ':' ,label='dotted')
Change the color
Colors can be defined in three main ways
- Defined by 1 character (8 types)
- Defined by Hex strings ex) ‘#008000’
- Defined by full name ex) palegreen, tab:olive
# step3 Plot a step graph
# Colors
ax.step(x, y, 'm' ,label='Magenta')
ax.step(x, y+2, '#0097a7' ,label='#0097a7')
ax.step(x, y+4, 'tomato' ,label='tomato')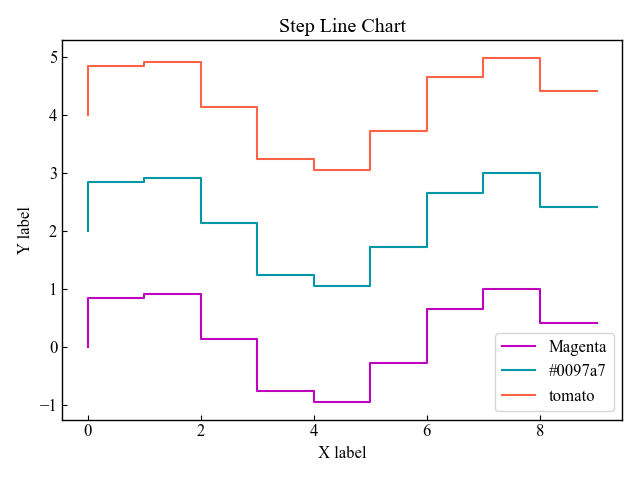
Define where the steps (where)
There are three types of step arrangements
- pre : step is the same as the previous x. ex) y=1 when x=0~1
- post : step is the same as x immediately after. ex) y=0 when x=0~1
- mid : step is mid x-coordinate
The graph below was drawn by comparing three different step arrangements and line graphs.
# step3 Plot a step graph
ax.step(x, y, where='pre', label='pre (default)')
ax.plot(x, y, 'o--', color='grey', alpha=0.4)

ax.step(x, y+2, where='mid',label='mid')
ax.plot(x, y+2, 'o--', color='grey', alpha=0.4)

ax.step(x, y+4, where='post', label='post')
ax.plot(x, y+4, 'o--', color='grey', alpha=0.4)

plt.show()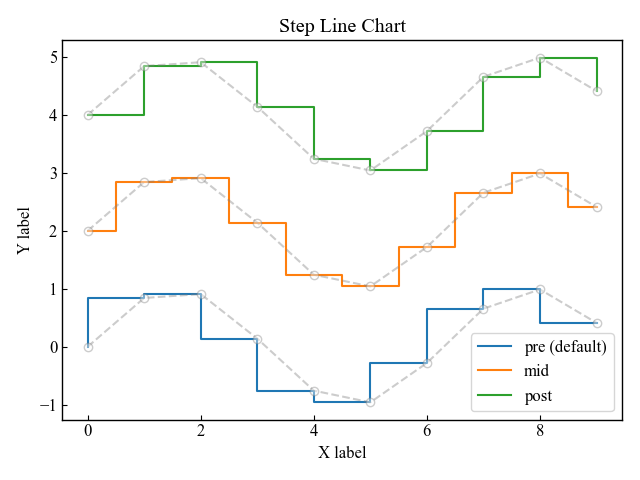
References
Axes.step function
Step Graph Demonstration
Axes.plot function (fmt: format string)
Matplotlib Color Types
Comments