You need an overall view of the graph, but you may want a zoomed-in view of an area.
You can create a zoomed-in view by changing the axis scales, but it is not very smart since it is in a separate file.
In this article, I explain how to display both a zoomed view and an overall view of a graph in the same Fig in Matplotlib in python.
I also explain how to customize the placement of the enlargements to the top or right.
Zoom graph in the graph (inset_axes, indicate_inset_zoom)
The zoomd view is drawn in a graph created with Matplotlib.
It uses two of them, Axes.inset_axes and Axes.indicate_inset_zoom
The following tabs explain with codes and flowcharts
import matplotlib.pyplot as plt
import numpy as np

# step1 Create data
x = np.linspace(0, 10, 100)
y1 = 4 + 2 * np.sin(2 * x)
y2 = 4 + 2 * np.cos(2 * x)
# step2 Create graph frames
fig, ax = plt.subplots(figsize=[6.4, 4.8])
# step3 Plot line graphs
ax.plot(x, y1, linestyle='-', label='Sample 1')
ax.plot(x, y2, linestyle='--', label='Sample 2')

ax.set_xlim(0, 10)
ax.set_ylim(0, 10)
ax.set_xlabel('X label')
ax.set_ylabel('Y label')
ax.legend(loc='upper left')

# step4 Plot a zoomed graph
axins = ax.inset_axes([0.6, 0.6, 0.37, 0.37])
axins.plot(x, y1, linestyle='-', label='Sample 1')
axins.plot(x, y2, linestyle='--', label='Sample 2')
# setting of a zoomed graph
x1, x2, y1, y2 = 2, 4, 4, 6
axins.set_xlim(x1, x2)
axins.set_ylim(y1, y2)
ax.indicate_inset_zoom(axins)

plt.show()
How to use the Axes.inset_axes function
This chapter explains how to determine the coordinates of a zoomed figure and how to create a zoomed figure object.
The argument is a list of [x0, y0, width, height] values between 0 and 1.
Finally, the generated axins instance are plotted in the same way as in the overall diagram.
- Parameters
-
- bounds (x0, y0, width, height) : Lower-left corner of inset Axes, and its width and height.
- projection (str) : The projection type of the inset Axes. str is the name of a custom projection, see projections.
- polar (bool) : If True, equivalent to projection=’polar’.
- zorder (float) : Defaults to 5. Adjust higher or lower to change whether it is above or below data plotted on the parent Axes.
- Returns
-
- ax : The created Axes instance.
- Official Documentation
How to use the Axes.indicate_inset_zoom function
Drawing lines from the overall view to the zoomed view and rectangles of the zoomed area
If you use the “overall graph”.indicate_inset_zoom (zoomed graph), it will be displayed
- Parameters
-
- inset_ax (Axes) : This axis is used to draw a pull-out line. Two lines connecting the magnified area and the magnified figure are automatically drawn.
- facecolor (color) : Color of the area in a zoomed graph
- edgecolor (color) : Color of drawer lines in a zoomed graph
- alpha (float) : transparency
- zorder (float) : The default is 4.99. It is placed just below Axes.inset_axes.
- **kwargs : For other arguments, please refer to Axes.indicate_inset
- Returns
-
- rectangle_patch (patches.Rectangle) : Rectangle artist.
- connector_lines (4-tuple of patches.ConnectionPatch) : There are four drawer lines: lower left, upper left, lower right, and upper right, two with visibility set to False.
- Official Documentation
Zoomed graph on the top (subplots_adjust)
This chapter explains how to plot a zoomed graph without covering the top of the overall graph.
Adjusting the position and graph size of the subplots created by plt.subplots will display them nicely.
- Parameters
-
- left (float) : The position of the left edge of the subplots, as a fraction of the figure width.
- right (float) : The position of the right edge of the subplots, as a fraction of the figure width.
- bottom (float) : The position of the bottom edge of the subplots, as a fraction of the figure height.
- top (float) : The position of the top edge of the subplots, as a fraction of the figure height.
- wspace (float) : The width of the padding between subplots, as a fraction of the average Axes width.
- hspace (float) : The height of the padding between subplots, as a fraction of the average Axes height
- Official Documentation
The following tabs explain with codes and flowcharts
# step2 Create graph frames
fig, ax = plt.subplots(figsize=[6.4, 6.4])
# step3 Plot line graphs
ax.plot(x, y1, linestyle='-', label='Sample 1')
ax.plot(x, y2, linestyle='--', label='Sample 2')

# step4 Plot a zoomed graph
axins = ax.inset_axes([0.58, 1.08, 0.42, 0.37])
axins.plot(x, y1, linestyle='-', label='Sample 1')
axins.plot(x, y2, linestyle='--', label='Sample 2')

# Setting of a zoomed graph
x1, x2, y1, y2 = 2, 4, 4, 6
axins.set_xlim(x1, x2)
axins.set_ylim(y1, y2)
ax.indicate_inset_zoom(axins)

# Ajust Aspect Ratio
ax.set_box_aspect(0.75)
# Adjust the subplot position
fig.subplots_adjust(bottom=0.11, top=0.7)

plt.show()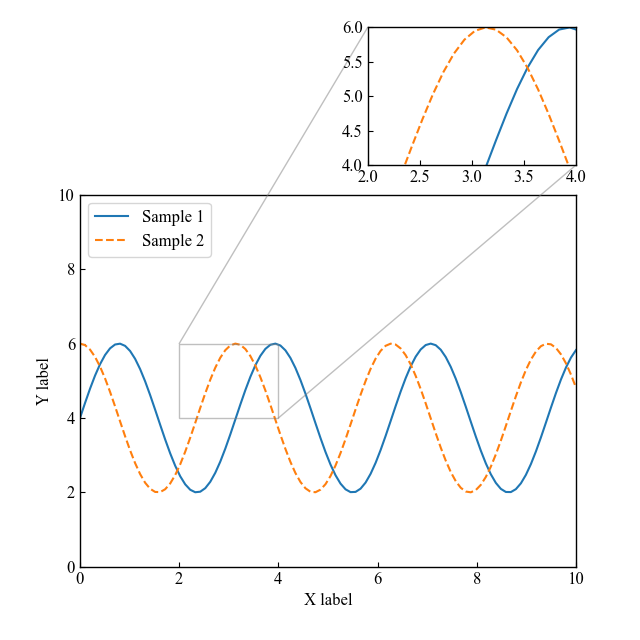
Zoomed graph on the right
This chapter explains how to plot a zoomed graph without covering the right part of the overall graph.
Adjusting the position and graph size of the subplots created by plt.subplots will display them nicely.
The following tabs explain with codes and flowcharts
# step2 Create graph frames
fig, ax = plt.subplots(figsize=[7, 4.8])
# step3 Plot line graphs
ax.plot(x, y1, linestyle='-', label='Sample 1')
ax.plot(x, y2, linestyle='--', label='Sample 2')

# step4 Plot a zoomed graph
axins = ax.inset_axes([1.05, 0.63, 0.42, 0.37])
axins.plot(x, y1, linestyle='-', label='Sample 1')
axins.plot(x, y2, linestyle='--', label='Sample 2')

# Setting of a zoomed graph
x1, x2, y1, y2 = 2, 4, 4, 6
axins.set_xlim(x1, x2)
axins.set_ylim(y1, y2)
ax.indicate_inset_zoom(axins)
# Ajust Aspect Ratio
ax.set_box_aspect(0.75)
# Ajust the subplot position
fig.subplots_adjust(left=0.11, right=0.7)

plt.show()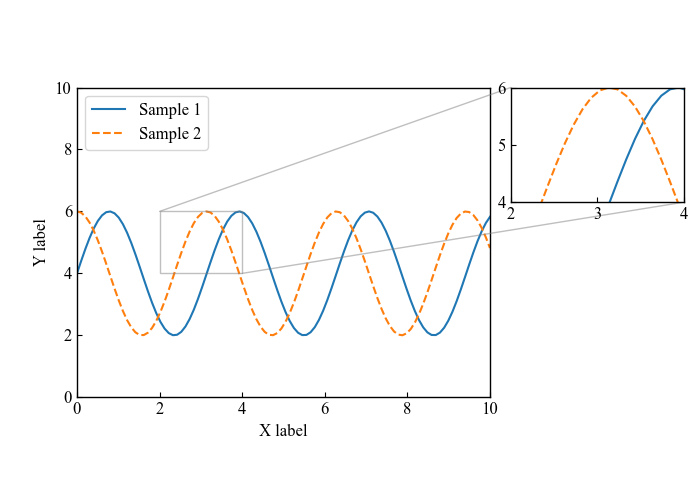
References
Zoom a Graph in Matplotlib
Official documentation for the Axes.inset_axes function
Official documentation for the Axes.indicate_inset_zoom function
Comments