You may want to grasp the trend or variation of your data at a glance, but are at a loss as to how to draw a box-and-whisker diagram or how to display its elements.
In this article, I will carefully explain how to display box-and-whisker plots and their means, medians, and outliers through Matplotlib’s boxplot function.
Acquire the skills to accurately understand the characteristics of your data.
After reading this article, you will be able to effectively visualize the trends and variations in your dataset using Matplotlib’s boxplot!
Please refer to the following article for a violin chart that adds data distribution to the box-and-whisker plot
Axes.boxplot function
Box-and-Whisker Plots are drawn by passing an array as an argument to the Axes.boxplot function.
- Parameters
-
- x (array):The input data. One in 1D array, multiple in 2D array
- notch (bool) : Whether to draw a notched boxplot (True), or a rectangular boxplot (False) .
- sym (str) : The default symbol for flier points. An empty string (”) hides the fliers.
- whis (float) : The position of the whiskers.
- positions (array):The positions of the boxes.
- vert (bool):The direction of the box. If True, draws vertical boxes. If False, draw horizontal boxes.
- widths (float, array):The widths of the boxes.
- patch_artist (bool) : If False produces boxes with the Line2D artist. Otherwise, boxes are drawn with Patch artists.
- showmeans (bool):Show the arithmetic means.
- meanline (bool) : Show the average line.
- medianprops (dict) : The style of the median.
- meanprops (dict) : The style of the mean.
- Returns
-
dict: Dictionary for each element of the boxplot function
- boxes (Line2D) : the main body
- medians (Line2D) : horizontal lines at the median
- whiskers (Line2D) : the vertical lines extending to the most extreme, non-outlier data points.
- caps (Line2D) : the horizontal lines at the ends of the whiskers.
- fliers (Line2D) : points representing data that extend beyond the whiskers.
- means (Line2D) : points or lines representing the means.
- Official Documentation
General box-and-whisker plot
For 1D arrays, one box-and-whisker plot is drawn.
For 2D arrays, multiple box-and-whisker plots are drawn.
The following tabs explain the code and flowchart
import matplotlib.pyplot as plt
import numpy as np

# step1 Fix the random numbers generated
np.random.seed(19680801)
# step2 Create data
all_data = [np.random.normal(0, std, 100) for std in range(7, 10)]
labels = ['x1', 'x2', 'x3']
# step3 Create graph frames
fig, ax = plt.subplots()

# step4 Plot a box-and-whisker plot
# General box-and-whisker plot
ax.boxplot(all_data, labels=labels)
ax.set_title('basic plot')

ax.set_xlabel('X label')
ax.set_ylabel('Y label')

plt.show()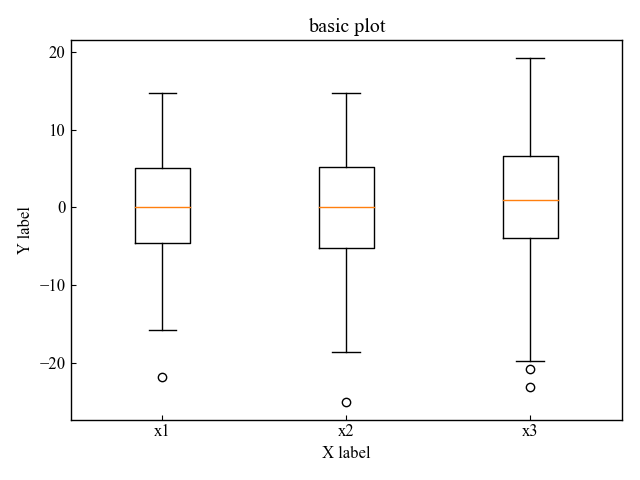
Notched box-and-whisker plot (notch)
Displays a notched box-and-whisker plot with a box indentation.
The notches represent the confidence interval (CI) around the median.
Enter 1 or True for the second argument, notch, of the Axes.boxplot function
# step4 Plot a box-and-whisker plot
# notched
ax.boxplot(all_data, 1, labels=labels)

plt.show()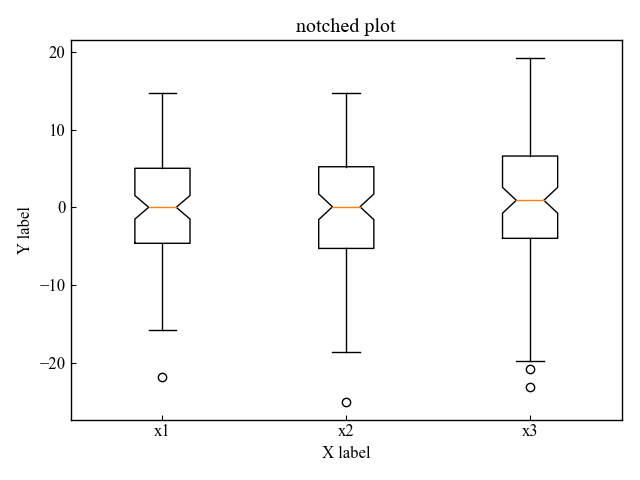
Outliers (sym, whis)
Box-and-whisker plot shows outliers.
The outliers can be customized with colors and symbols and can be hidden.
Color and shape of outlier symbols (sym=’gD’)
Customize the symbols for box-and-whisker outliers
Enter a string in the third argument, sym, of the Axes.boxplot function.
# step4 Plot a box-and-whisker plot
# Outlier Symbols
ax.boxplot(all_data, sym='gD', labels=labels)

plt.show()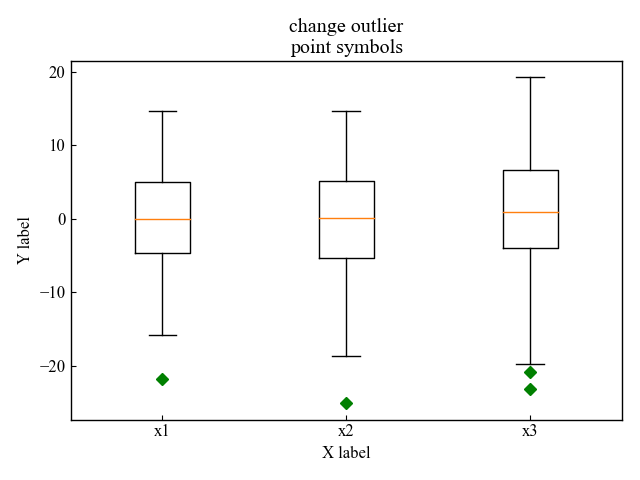
Without the Outliers (sym=’empty string’)
Do not display outlier points in box-and-whisker plots
The third argument, sym, of the Axes.boxplot function is passed an empty string.
# step4 Plot a box-and-whisker plot
# Do not show outliers
ax.boxplot(all_data, sym='', labels=labels)

plt.show()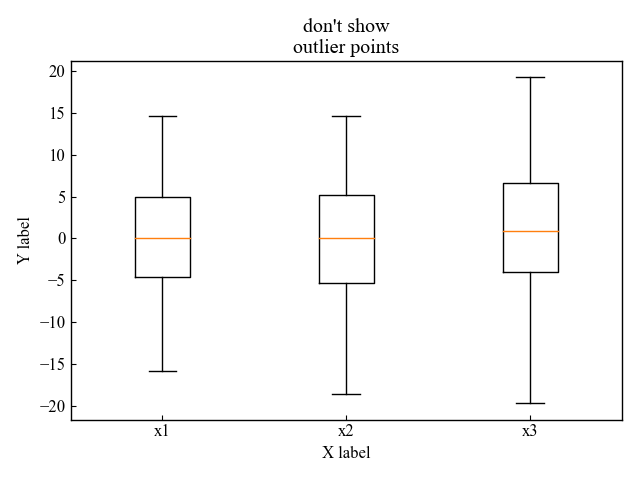
Range of outliers (whis)
Adjust the length of the box-and-whisker diagram to set the outlier range.
Enter a number in the fifth argument of the Axes.boxplot function, whis
1.5 is specified by default
# step4 Plot a box-and-whisker plot
# Adjust beard length to change the outlier region
ax.boxplot(all_data, sym='rs', whis=0.75, labels=labels)

plt.show()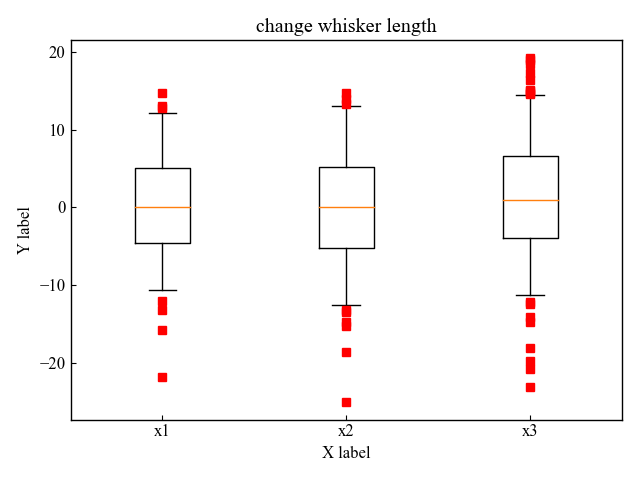
Horizontal box-and-whisker plot (vert)
Displays a box-and-whisker diagram horizontally
Enter 0 or false for the fourth argument, vert, of the Axes.boxplot function
# step4 Plot a box-and-whisker plot
# Horizontal box-and-whisker plot
ax.boxplot(all_data, sym='rs', vert=False, labels=labels)

plt.show()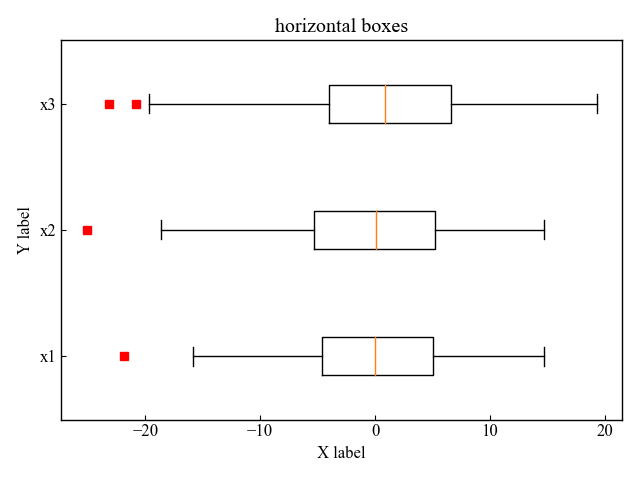
Color of box and frame (patch_artist)
Customize the color of the box on the box-and-whisker plot in a stylish way.
In the argument of the Axes.boxplot function, set patch_artist = True and replace it with the variable (bplot).
Color of the box (set_color, set_facecolor)
The color of the boxes can be changed using set_color or set_facecolor in the [‘boxes’] attribute of the box-and-whisker plot.
- set_color : Whole box. The frame is included
- set_facecolor : Inside the box. The frame is not included
# step4 Plot a box-and-whisker plot
# Color of the box
bplot = ax.boxplot(all_data, labels=labels, patch_artist=True)
# Color List
colors = ['pink', 'lightblue', 'lightgreen']
# Assign colors to each box
for patch, color in zip(bplot['boxes'], colors):
    patch.set_color(color)

plt.show()
# step4 Plot a box-and-whisker plot
# Color of the box
bplot = ax.boxplot(all_data, labels=labels, patch_artist=True)
# Color list
colors = ['pink', 'lightblue', 'lightgreen']
# Assign colors to each box
for patch, color in zip(bplot['boxes'], colors):
    patch.set_facecolor(color)

plt.show()
Box Frame (edgecolor, linewidth)
You can assign a box color with set_edgecolor and a box thickness with set_linewidth to the [‘boxes’] attribute of the box-and-whisker plot.
# step4 Plot a box-and-whisker plot
# Color of the box
bplot = ax.boxplot(all_data, labels=labels, patch_artist=True)
# Color list
colors = ['pink', 'lightblue', 'lightgreen']
# Assign colors to each box
for patch, color in zip(bplot['boxes'], colors):
    # Box Color
    patch.set_color('white')
    # Frame Color
    patch.set_edgecolor(color)
    # Frame thickness
    patch.set_linewidth(3)

plt.show()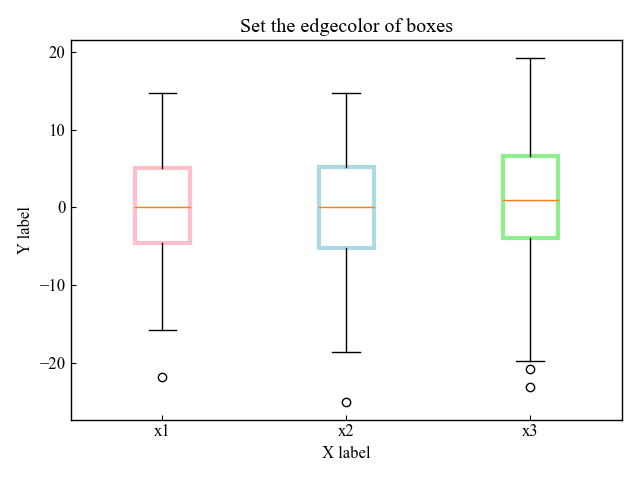
Average (showmeans, meanline)
In Matplotlib, the median is displayed by default for box-and-whisker plots, but the mean can also be displayed.
There are two ways of displaying the symbols and lines, and each will be explained separately.
Average with a symbol (showmeans)
Set showmeans=True in the Axes.boxplot function argument
# step4 Plot a box-and-whisker plot
# Average value
ax.boxplot(all_data, labels=labels, showmeans=True)

plt.show()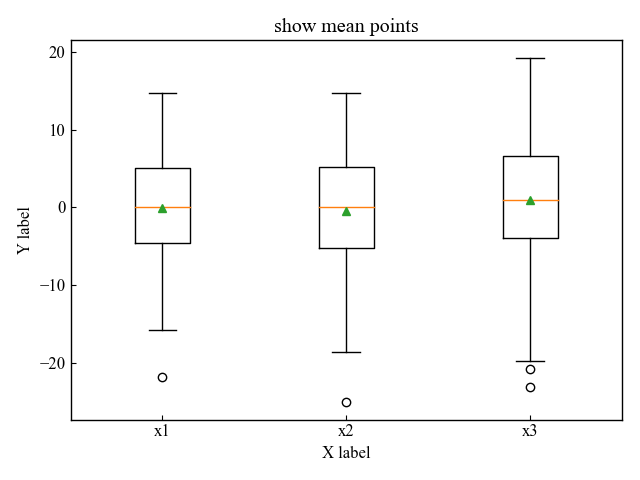
Average with a line (meanline)
Set showmeans=True and meanline=True as arguments to the Axes.boxplot function.
# step4 Plot a box-and-whisker plot
# Average value
ax.boxplot(all_data, labels=labels, showmeans=True, meanline=True)

plt.show()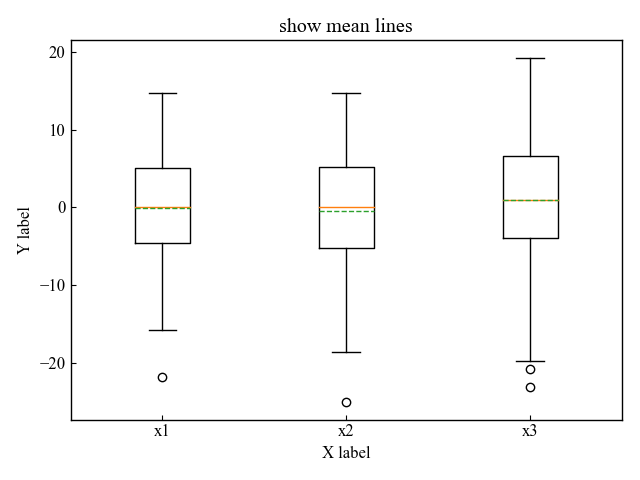
Customize median and mean (medianprops, meanprops)
Feel free to tinker with the median and mean of the box-and-whisker diagram!
Set each parameter in dictionary type to medianprops and meanprops
Median color and line style (medianprops)
Enter a dictionary in the medianprops argument of the Axes.boxplot function.
- color : Color of a line.
- linewidth : Line width.
- linestyle : Line style. ex) –, —, -., :
# step4 Plot a box-and-whisker plot
# Median
ax.boxplot(
    all_data,
    labels=labels,
    medianprops={
        'color': 'C0',
        'linewidth':3,
        'linestyle': '-.',
    }
)

plt.show()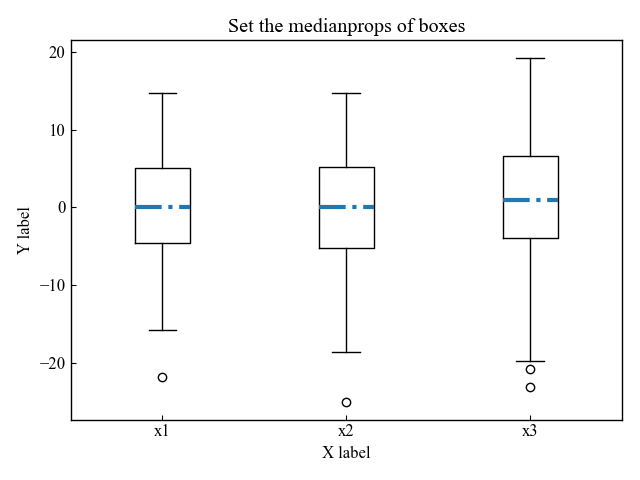
Average color and line style (meanprops)
Enter a dictionary in the meanprops argument of the Axes.boxplot function
Also, the median is hidden.
- marker : Marker Shape
- markersize : Marker Size
- markerfacecolor : Color of marker surface, specified in string
- markeredgecolor : Color of marker border, specified in RGB
- markeredgewidth : Marker frame thickness
# step4 Plot a box-and-whisker plot
# Average
ax.boxplot(all_data, labels=labels, showmeans=True,
            # median not shown
            medianprops={
                'visible': False
            },
            # Customize averages
            meanprops={
                'marker': 'v',
                'markersize': 7,
                'markerfacecolor': 'white',
                'markeredgecolor': '#0097a7',
                'markeredgewidth': 2,
            }
)

plt.show()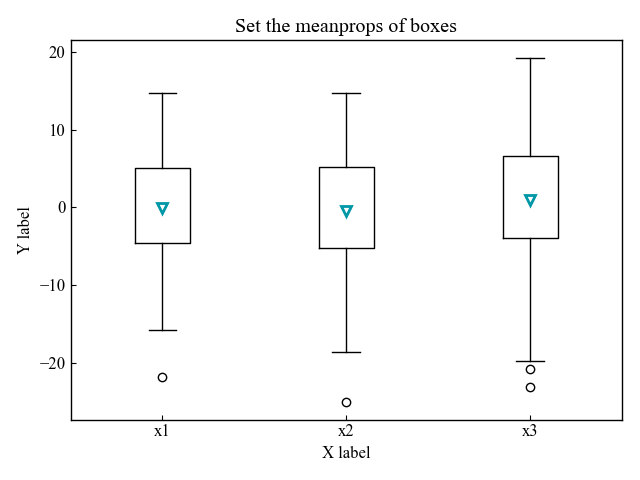
References
Box-and-whisker diagram demonstration
Box-and-whisker diagram color settings
Comments